. 2021 Jun 10;12(1):3523.
doi: 10.1038/s41467-021-23472-7.

A new molecular classification to drive precision treatment strategies in primary Sjögren's syndrome

Collaborators, Affiliations

A new molecular classification to drive precision treatment strategies in primary Sjögren's syndrome

Perrine Soret et al. Nat Commun. .

Abstract

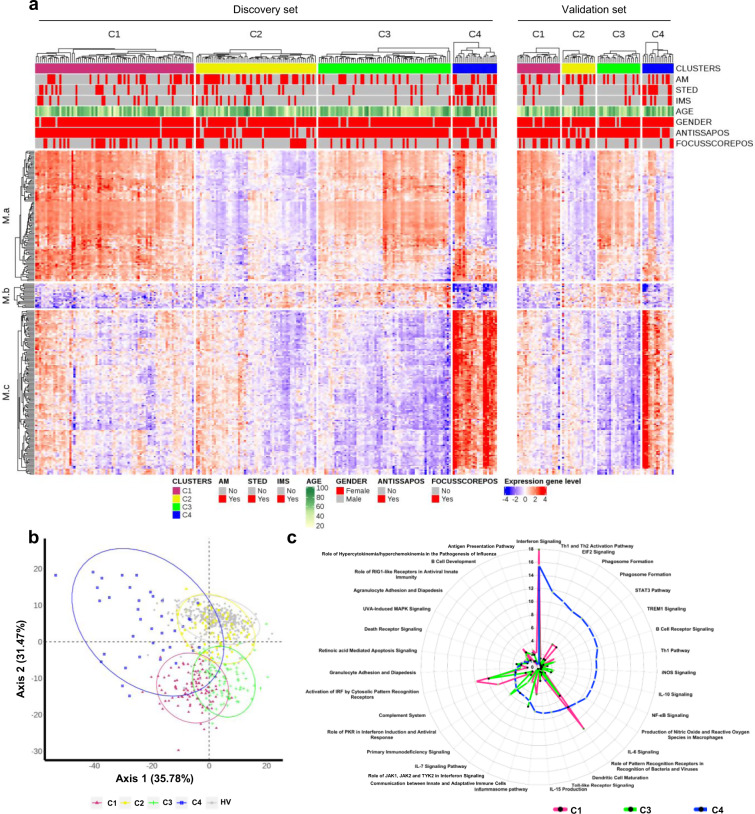
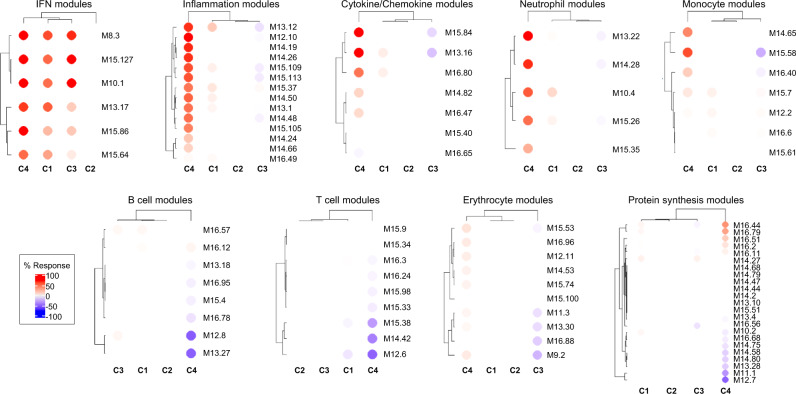
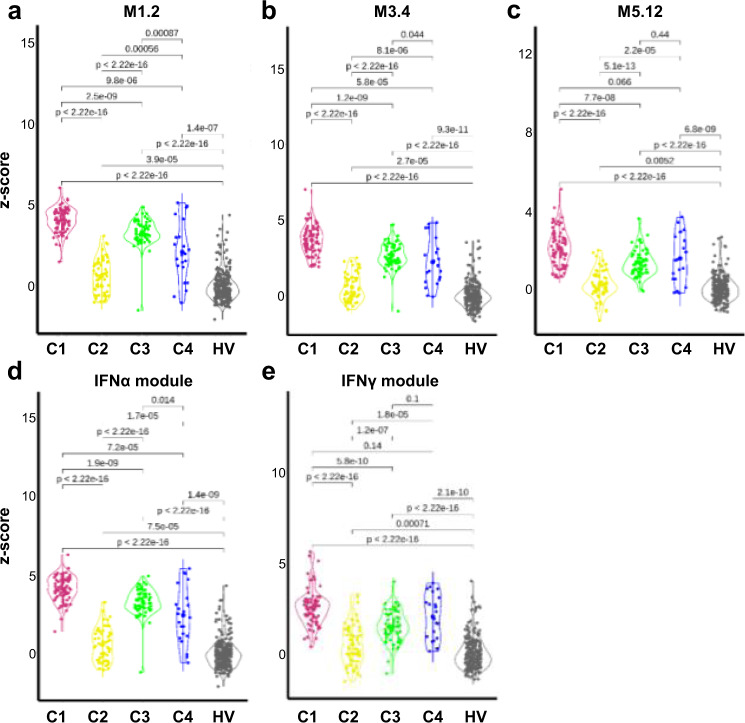
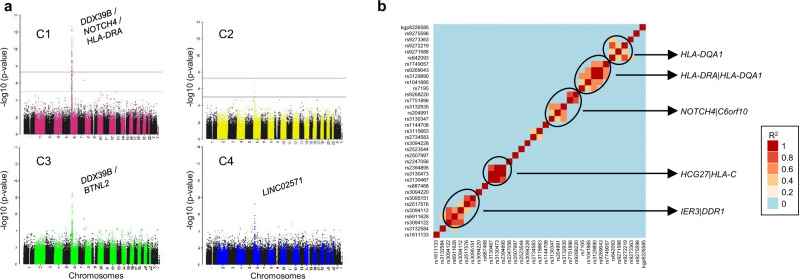
There is currently no approved treatment for primary Sjögren's syndrome, a disease that primarily affects adult women. The difficulty in developing effective therapies is -in part- because of the heterogeneity in the clinical manifestation and pathophysiology of the disease. Finding common molecular signatures among patient subgroups could improve our understanding of disease etiology, and facilitate the development of targeted therapeutics. Here, we report, in a cross-sectional cohort, a molecular classification scheme for Sjögren's syndrome patients based on the multi-omic profiling of whole blood samples from a European cohort of over 300 patients, and a similar number of age and gender-matched healthy volunteers. Using transcriptomic, genomic, epigenetic, cytokine expression and flow cytometry data, combined with clinical parameters, we identify four groups of patients with distinct patterns of immune dysregulation. The biomarkers we identify can be used by machine learning classifiers to sort future patients into subgroups, allowing the re-evaluation of response to treatments in clinical trials.


Conflict of interest statement

While engaged in the research project, R.L., F.M., and Z.M. were regular employees of Bayer A.G. At present, R.L. and Z.M. are regular employees of Nuvisan ICB GmbH, a company providing contract research services. P.S., S.H., S.C.G., L.X., M.G., P.M., and L.L. were regular employees of Institut de Recherches Internationales Servier at the time of the research project. B.C., C.B., and E.D. were phD students financed by Institut de Recherches Internationales Servier when they contributed to the research project. All other authors confirmed signing the ICMJE form for Disclosure of Potential Conflicts of Interest and none of them have any conflict of interest related to this work.

Figures

Fig. 1
Fig. 1. Molecular pattern distribution is represented by 4 clusters of pSS patients with different canonical pathways.
a Heatmap performed for 304 pSS patients (Discovery set: 227, Validation set: 77) showing the distribution of gene transcripts across the 4 clusters. In columns patients are grouped by cluster assignment and in rows genes are grouped by functional modules. Each subset of patients (discovery set on the left and validation set on the right) is presented separately. Red represents overexpression and blue represents under-expression. At the top of the figure annotations show: each of the treatment groups for each individual (AM: antimalarials, STED: steroids and IMS: immunosuppressors, red represents patients with treatment and gray represents patients without treatment), age (levels of yellow to green with yellow for younger patients and dark green for older patients), gender (red represents woman and gray represents man), ANTISSAPOS: anti-SSA/Ro antibody positivity, FOCUSSCOREPOS: focus score of ≥1 foci/mm2 (red represents focus score of ≥1 foci/mm2 and gray represents focus score of <1 foci/mm2). b Scatterplot of the first two components PCA (performed for 304 pSS patient and 330 HV) model showing clearly defined clusters in signature gene. HV (gray dot) are confused with C2 cluster (yellow dot). c Top 20 most significant canonical pathways for each cluster. Radar plots are represented according to ‒log (p-value) (Fisher’s exact test) associated to the most significant pathways of each cluster; C1 (pink), C3 (green), C4 (blue).
Fig. 2
Fig. 2. Patterns of abundance of the different modules distinguish the four pSS clusters.
Each heatmap, achieved with BloodGen3Module R package, represents one of the most significant patterns differentiating the four clusters of 304 pSS patients (C1: 101, C2: 77, C3: 88, and C4: 38) compared to 330 healthy volunteers (HV). These patterns correspond to modules associated with IFN, neutrophils, inflammation, cytokines/chemokines, protein synthesis, erythrocytes, monocytes, B cells and T cells. Columns on this heatmap corresponds to clusters. Each row corresponds to one of the modules associated with the pattern. For each module, the percentage of increased genes (from 0 to 100) and decreased genes (from 0 to 100) were calculated. A red spot on the heatmap indicates an increase in abundance of transcripts comprising a given module for a given cluster. A blue spot indicates a decrease in abundance of transcripts. The absence of color indicates no changes.
Fig. 3
Fig. 3. The 4 pSS clusters show typical IFN signature according to modular IFN z-scores.
IFN score analyses were performed for 304 pSS patients and 330 healthy volunteers (HV). Repartition of samples from the 4 pSS clusters are shown according to the most characterized IFN module z-scores. The genes (IFI44, IFI44L, IFIT1 and MX1) of the M1.2 module (a) are induced by IFNα, while genes from both M1.2 and M3.4 (b) (ZBP1, IFIH1, EIF2AK2, PARP9 and GBP4) are up-regulated by IFNβ. c The genes (PSMB9, NCOA7, TAP1, ISG20 and SP140) from the M5.12 module are poorly induced by IFNα and IFNβ alone while they are up-regulated by IFNγ. Moreover, transcripts belonging to M3.4 and M5.12 were only fully induced by a combination of Type I and Type II IFNs. Other modules identified genes preferentially induced by IFNα (IFIT1, IFI44 and EIF2AK2) (d) or IFNγ (IRF1, GBP1 and SERPING1) (e). Two-tailed pairwise Wilcoxon-rank sum test results are shown. Plots show median with error bars indicating ± interquartile range.
Fig. 4
Fig. 4. Cluster genome-wide association analyses (GWAS).
GWAS analysis was performed using Plink, an open-source whole genome association analysis toolset, using a logistical regression for 304 pSS (C1: 101, C2: 77, C3: 88 and C4: 38) patients and 330 healthy volunteers (HV) and each cluster was compared to HV. a Manhattan plots for each cluster are shown. b Linkage disequilibrium analysis in the loci of the 35 SNPs detected in C1 and located on chromosome 6 from base 29809362 to base 32681631. The R2 correlation coefficient and linkage disequilibrium heatmap were obtained with Plink, and oncofunco R package, respectively. Strongest associations between SNPs are annotated.
Fig. 5
Fig. 5. Methylation analysis confirms the strong IFN signature in C1 and C3 and reveals an aberrant methylation status in C4.
Whole blood methylation analysis was performed for 226 pSS patients (C1: 81, C2: 57, C3: 62, and C4: 26) and 175 healthy volunteers (HV) doing pairwise comparisons between each cluster and HV. a Venn diagram showing the overlap of differentially methylated CpG sites and genes between the 4 clusters with absolute ΔBeta > 0.075. b DMP distribution across the different genomic regions (gene body, 3’UTR, intergenic (IGR), 5’UTR, Exon 1, TSS 1500 and TSS 200; and according to the CpG density to CpG island, shelf, shore, and open sea. c Venn diagram showing the overlap of hypomethylated CpG and genes with absolute ΔBeta > 0.15 between the three IFN clusters. d Interaction network of these 5 genes common to the three clusters by STRING analysis with a confidence cut-off of 0.4 reveals a common IFN signature. e Interaction network of the 10 genes hypomethylated common to C1 and C3 by STRING analysis with a confidence cut-off of 0.4. f Reactome analysis of the functional pathways enriched for the 126 genes hypomethylated and over expressed in C4 (absolute ΔBeta > 0.15, FC ≥ 1.5).
Fig. 6
Fig. 6. Cell subset distribution in blood and cytokines, chemokines and inflammatory mediators in serum in the 4 clusters and healthy volunteers (HV).
a Flow cytometry analysis was performed for 283 patients (C1: 96, C2: 71, C3: 80, and C4: 36) and 309 HV. The 2 heatmaps show the mean distribution of blood cell subsets in frequency (0–100%) and in absolute numbers (per µL of blood) across the 4 clusters and HV assessed by flow cytometry. Columns represent clusters and HV and rows the different cell subsets. The asterisk means that the cluster (or HV) is statistically different from all the others. b Flow cytometry data represented by bar charts cell types proportion per cluster. c Serum mediators were analyzed for 192 pSS patients (C1: 67, C2:48, C3: 61, C4:16) and 171 HV. Patient and HV distribution according to each analyzed variable is described in Methods. CXCL13/BLC, FAS Ligand, GDF-15, CXCL10/IP-10, CCL8/MCP-2, CCL13/MCP-4, CCL4/MIP-1β, MMP-8, CCL17/TARC, IL-1 RII, TNF-RI, and IL1-RA were measured using the Luminex system and expressed as pg/ml. Soluble MMP-2, CRP, TNFα, IL-6, BAFF, and TGFβ were measured by the quantitative sandwich enzyme immunoassay technique and expressed as pg/ml. Cytokine or chemokine concentration levels for each cluster were compared to HV. Statistical significance is determined using a one-way ANOVA followed by post-hoc Tukey’s test. The significance between the cluster and HV is represented as bullet ranging from small (non-significant) to big (significant). The direction of the association is shown as the z-score where red bullet is up-regulated, and blue bullet is down-regulated.
Fig. 7
Fig. 7. Disease activity and serological distributions in the 4 clusters.
a ESSDAI collected for 193 pSS patients (C1: 70, C2: 52, C3: 44, C4: 27), PGA collected for 286 pSS patients (C1: 94, C2: 71, C3: 85, C4: 36,) and ESSPRI collected for 150 pSS patients (C1: 56, C2: 43, C3: 30, C4: 21) distributions are shown in the 4 clusters. Two-tailed pairwise Wilcoxon-rank sum test results are shown. b The barplot shows the proportion of past (light orange) or present (orange) hypergammaglobulinemia (C1: 97, C2: 73, C3: 86, C4: 38) in each cluster. c Extractable nuclear antigen antibodies, anti-SSA antibodies, anti-SSA antibodies (Ro-52), anti-SSA antibodies (Ro-60), anti-SSB antibodies, rheumatoid factor were performed for 304 pSS patients (C1: 101, C2:77, C3:88, C4:38) and 330 HV and measured in serum, at the same center, using an automated chemiluminescent immunoanalyzer (IDS-iSYS). Barplots show the proportion of concentration level in each cluster (black: negative, light pink: low, orange: medium, red: elevated and dark red: high). Turbidimetry was used for rheumatoid factor (RF), complement fractions C3c and C4 determination and circulating free light chains. Statistical significance is determined by two-tailed pairwise Wilcoxon-rank sum test. Plots show median with error bars indicating ± interquartile range. Patient and HV distribution according to PGA and biological parameters analyzed variable is described in Methods.
Fig. 8
Fig. 8. Development of a composite model to predict the belonging of a patient to one of the 4 clusters.
a Confusion matrix of the composite model in the discovery cohort performed for 227 pSS patients (C1: 79, C2: 60, C3: 66, and C4: 22) is shown. b Discriminant function analysis (DFA) of the predicted patients from the discovery cohort shows clearly separated clusters. Two different views of the same DFA are shown. c DFA of the predicted patients from the inception cohort shows clearly separated clusters. Two different views of the same DFA are shown. Thirty-seven pSS patients from the inception cohort were analyzed and predicted as C1: 16, C2: 6, C3: 7, and C4: 8.

Similar articles

Cited by

References

    1. Brito-Zerón P, et al. Sjögren syndrome. Nat. Rev. Dis. Primers. 2016;2:16047. doi: 10.1038/nrdp.2016.47. - DOI - PubMed
    1. Baldini C, et al. Primary Sjogren’s syndrome as a multi-organ disease: impact of the serological profile on the clinical presentation of the disease in a large cohort of Italian patients. Rheumatology (Oxford) 2014;53:839–844. doi: 10.1093/rheumatology/ket427. - DOI - PubMed
    1. Qin B, et al. Epidemiology of primary Sjögren’s syndrome: a systematic review and meta-analysis. Ann Rheum. Dis. 2015;74:1983–1989. doi: 10.1136/annrheumdis-2014-205375. - DOI - PubMed
    1. Goules AV, Tzioufas AG. Primary Sjӧgren’s syndrome: clinical phenotypes, outcome and the development of biomarkers. Autoimmun. Rev. 2016;15:695–703. doi: 10.1016/j.autrev.2016.03.004. - DOI - PubMed
    1. Barturen, G. et al. Integrative analysis reveals a molecular stratification of systemic autoimmune diseases. Arthritis Rheumatol. (2020) 10.1002/art.41610 https://doi:10.17881/th9v-xt85. - PubMed

Publication types

MeSH terms