. 2021 Dec 2;138(22):2244-2255.
doi: 10.1182/blood.2021011582.

Depalmitoylation rewires FLT3-ITD signaling and exacerbates leukemia progression

Affiliations

Depalmitoylation rewires FLT3-ITD signaling and exacerbates leukemia progression

Kaosheng Lv et al. Blood. .

Abstract

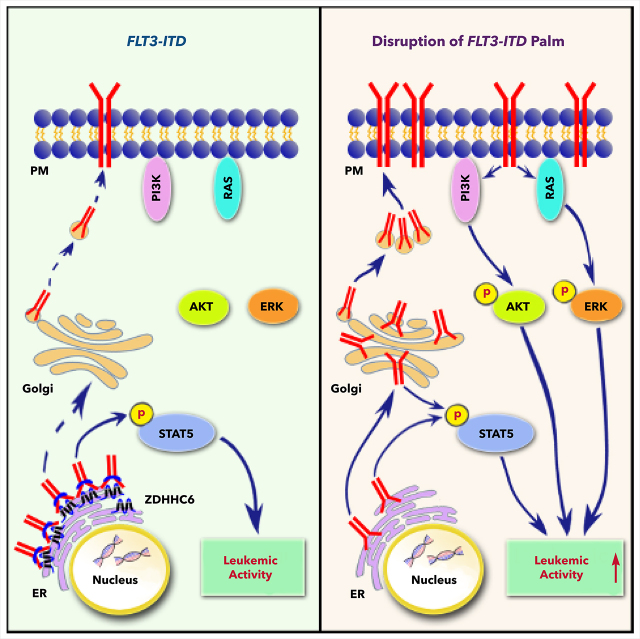
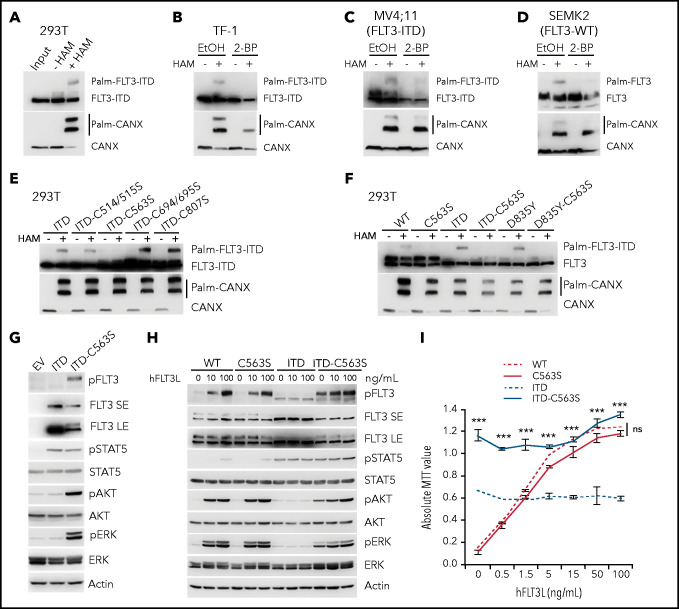
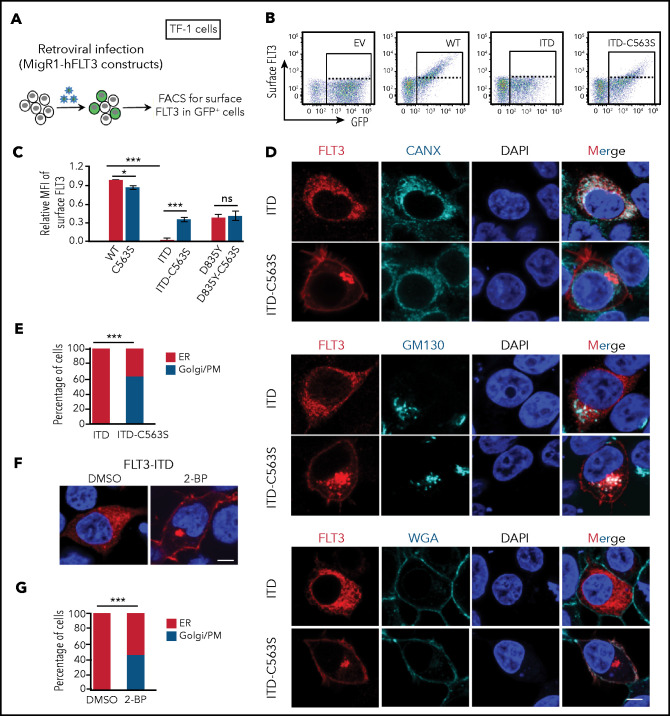
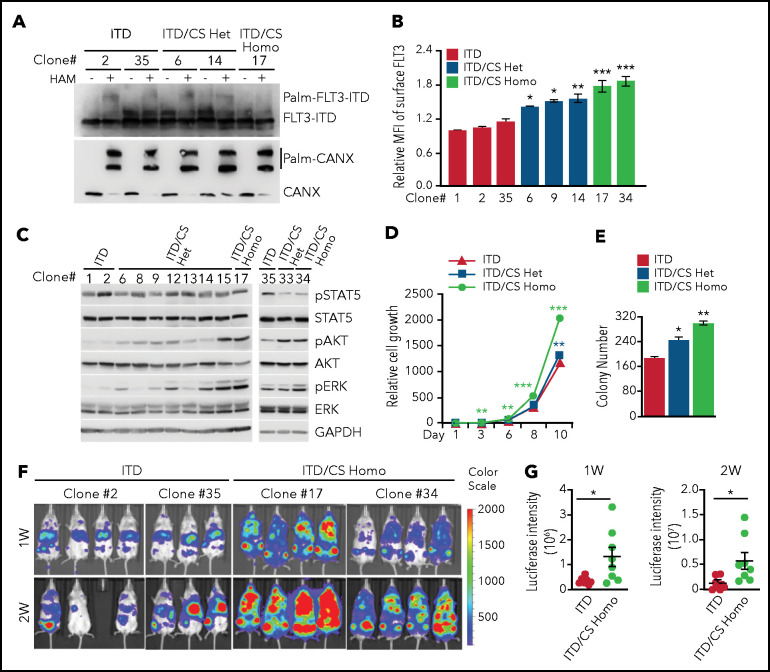
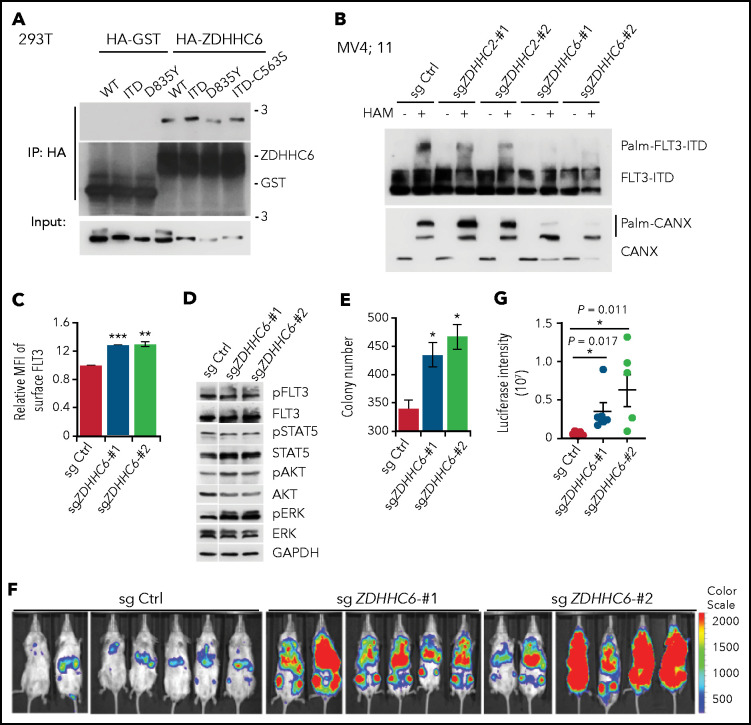
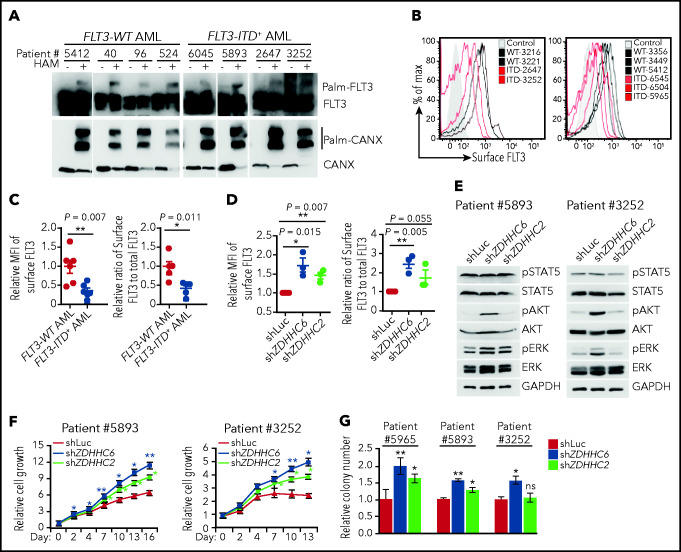
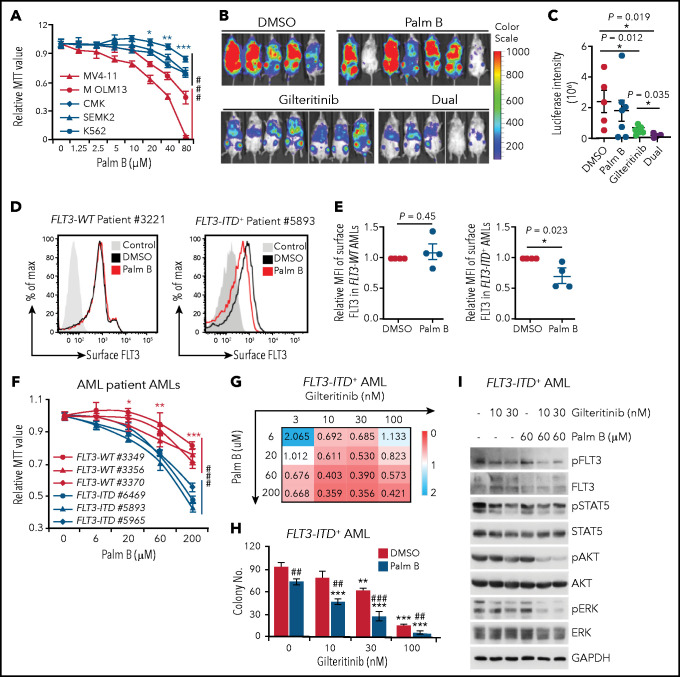
Internal tandem duplication within FLT3 (FLT3-ITD) is one of the most frequent mutations in acute myeloid leukemia (AML) and correlates with a poor prognosis. Whereas the FLT3 receptor tyrosine kinase is activated at the plasma membrane to transduce PI3K/AKT and RAS/MAPK signaling, FLT3-ITD resides in the endoplasmic reticulum and triggers constitutive STAT5 phosphorylation. Mechanisms underlying this aberrant FLT3-ITD subcellular localization or its impact on leukemogenesis remain poorly established. In this study, we discovered that FLT3-ITD is S-palmitoylated by the palmitoyl acyltransferase ZDHHC6. Disruption of palmitoylation redirected FLT3-ITD to the plasma membrane and rewired its downstream signaling by activating AKT and extracellular signal-regulated kinase pathways in addition to STAT5. Consequently, abrogation of palmitoylation increased FLT3-ITD-mediated progression of leukemia in xenotransplant-recipient mouse models. We further demonstrate that FLT3 proteins were palmitoylated in primary human AML cells. ZDHHC6-mediated palmitoylation restrained FLT3-ITD surface expression, signaling, and colonogenic growth of primary FLT3-ITD+ AML. More important, pharmacological inhibition of FLT3-ITD depalmitoylation synergized with the US Food and Drug Administration-approved FLT3 kinase inhibitor gilteritinib in abrogating the growth of primary FLT3-ITD+ AML cells. These findings provide novel insights into lipid-dependent compartmentalization of FLT3-ITD signaling in AML and suggest targeting depalmitoylation as a new therapeutic strategy to treat FLT3-ITD+ leukemias.


Figures

None
Graphical abstract
Figure 1.
Figure 1.
Palmitoylation of FLT3 at C563 specifically regulates FLT3-ITD–mediated signaling and cell growth. (A) Analysis of FLT3-ITD palmitoylation with the APE assay in 293T cells transiently expressing MigR1-FLT3-ITD. HAM, hydroxylamine (NH2OH). (B) APE analysis of TF-1 cells stably expressing MigR1-FLT3-ITD treated with the palmitoylation inhibitor 2-BP or vehicle control ethanol (EtOH). (C-D) Examination of palmitoylation of endogenous FLT3 proteins in FLT3-ITD+ MV4;11 AML cell line (C) and FLT3-WT SEMK2 cells (D). (E) Palmitoylation status of FLT3-ITD mutants with various cysteines mutated to serines by using the APE assay. (F) Examination of the effect of C563S mutation on the palmitoylation of FLT3-WT and oncogenic FLT3-ITD and FLT3-D835Y mutants in 293T cells. (G) TF-1 cells stably expressing empty vector (MigR1 or EV), FLT3-ITD, or FLT3-ITD-C563S were established, and cell lysates were subjected to WB analysis for various signaling proteins. ITD-C563S proteins showed 2 bands in the immunoblot with long exposure (LE), in comparison with short exposure (SE). (H) Signaling sensitivity to human FLT3L (hFLT3L). TF-1 cells stably expressing different FLT3 variants were starved and stimulated with a graded concentration of FLT3L for 10 minutes. Cell lysates were subjected to WB analysis with the indicated antibodies. (I) TF-1 cells as in panel H were plated in triplicate in a graded concentration of FLT3L for 3 days. Cell growth was examined using the MTT assay. In all relevant panels, data are presented as means ± standard deviation. ***P < .001; ns, not significant, as determined by 2-tailed Student t tests. MTT, 3-(4,5-dimethylthiazol-2-yl)-2,5-dimethyltetrazolium bromide; 3-[4,5-dimethylthiazol-2-yl]-2,5-diphenyltetrazolium bromide.
Figure 2.
Figure 2.
Disruption of palmitoylation alters FLT3-ITD intracellular localization. (A) Examination of FLT3 surface level elicited by C563S mutation. (B) Representative flow plots of surface FLT3 expression in TF-1 cells stably reconstituted with different MigR1-FLT3 variants. (C) Quantification of relative mean fluorescence intensity (MFI) of surface FLT3 by flow cytometry from 3 independent experiments. Data are presented as means ± standard error of the mean; P-values were determined by 2-tailed Student t tests. (D) Representative immunofluorescent confocal images of FLT3 (red) with the ER marker CANX (cyan, top panel), Golgi marker GM130 (cyan, middle panel), or AlexaFluor647-conjugated PM marker wheat germ agglutinin (WGA; bottom panel) in 293T cells expressing MigR1-FLT3-ITD or FLT3-ITD-C563S. The nuclei were stained with 4′,6-diamidino-2-phenylindole (DAPI; blue). Bar represents 10 μm. (E) Quantification of percentages of cells expressing FLT3-ITD (n = 90) or FLT3-ITD-C563S mutant (n = 84) with FLT3 distribution predominantly in the ER or Golgi/PM, as shown in panel D. (F) Representative confocal images of 293T cells expressing MigR1-FLT3-ITD treated or not with 2-BP. Immunofluorescence staining was performed as that in panel D. Bar represents 10 μm. (G) Quantification of percentages of cells with FLT3-ITD distributed predominantly in the ER or Golgi/PM in the absence (n = 106) or presence (n = 120) of 2-BP, as shown in panel F. (E,G) P-values were determined by Fisher’s exact test; (C) 2-tailed Student t tests. In all relevant panels, *P < .05; ***P < .001; ns, not significant.
Figure 3.
Figure 3.
Disruption of palmitoylation promotes leukemia cell growth and leukemia progression in vivo. (A) Examination of palmitoylation status of endogenous FLT3-ITD by using the APE analysis in different MV4;11 cell clones that were either not edited (ITD) or were edited for C563S heterozygous (ITD/CS Het) or homozygous (ITD/CS Homo) mutations via CRISPR/Cas9. (B) Quantification of surface FLT3 levels in ITD, ITD/CS Het, and ITD/CS Homo MV4;11 clones determined by flow cytometry. (C) Examination of downstream signaling in individual MV4;11 clones using WB analysis. (D) Relative cell growth of ITD, ITD/CS Het, and ITD/CS Homo MV4;11 clones at different days, as determined by enumeration of the cells. (E) Different MV4;11 clones were plated in methylcellulose media and the number of colony-forming leukemia cells quantified after 7 to 10 days. (F) Bioluminescence imaging of NSG mouse recipients of xenografts of unedited FLT3-ITD or of ITD/CS Homo–edited MV4;11 clones expressing firefly luciferase-T2A-mCherry at 1 and 2 weeks. (G) Quantification of bioluminescence signals of mouse recipients of xenografts as shown in panel F. Each symbol represents an individual mouse (ITD, n = 7; ITD/CS Homo, n = 8). Means ± standard error of the mean are presented as vertical lines. (B,D-E) Data analyses were performed in triplicate; results are presented as means ± standard deviation. In all relevant panels, *P < .05; **P < .01; ***P < .001; ns, not significant, as determined by 2-tailed Student t test.
Figure 4.
Figure 4.
ZDHHC6 is the predominant PAT for FLT3. (A) ZDHHC6 interacts with all FLT3 variants. 293T cells transfected with HA-GST (control) or HA-ZDHHC6, along with the indicated FLT3 constructs, were immunoprecipitated by HA-EZ agarose beads, followed by western blot (WB) analysis. (B) Examination of endogenous FLT3-ITD palmitoylation in MV4;11 cells depleted of ZDHHC2 or ZDHHC6 with 2 independent guide RNAs (gRNAs), by the APE assay. (C) Quantification of surface FLT3-ITD levels in MV4;11 cells depleted of ZDHHC6 by 2 different gRNAs in comparison with control (Ctrl) gRNA (n = 3). (D) WB analysis of signal transduction in MV4;11 cells depleted of ZDHHC6, in comparison with Ctrl gRNA. (E) Colony-forming capacity of MV4;11 cells depleted of ZDHHC6 in triplicate. (F) Bioluminescence imaging of NSG mouse recipients of MV4;11 cell transplants depleted of ZDHHC6 with 2 different gRNAs along with the control gRNA. (G) Quantification of bioluminescence signals from panel F. Single guide (sg) Ctrl (n = 7), sgZDHHC6-#1 (n = 6), or sgZDHHC6-#2 (n = 6). Each symbol represents an individual mouse. Means ± standard error of the mean are presented as vertical lines. (C,E) Data are presented as means ± standard deviation. In all relevant panels, *P < .05; **P < .01; ***P < .001; ns, not significant, as determined by 2-tailed Student t tests.
Figure 5.
Figure 5.
ZDHHC6-mediated palmitoylation restrains FLT3-ITD surface expression, signaling and colonogenic growth in primary human AMLs. (A) Examination of FLT3 palmitoylation in primary FLT3-WT and FLT3-ITD+ AML cells by the APE assay. (B) Flow cytometric plots showing cell surface FLT3 expression of various FLT3-WT (black traces) vs FLT3-ITD+ (red traces) primary AMLs. Control (shaded area) indicates secondary antibody only. (C) The quantification of the MFIs of surface FLT3 levels in FLT3-ITD+ AMLs (left; n = 5) relative to that in FLT3-WT AMLs (n = 6), as shown in panel B. Relative surface/total FLT3 level in FLT3-ITD+ AMLs (right) when compared with FLT3-WT AMLs. The total FLT3 levels were determined by flow cytometry after fixation and permeabilization of AML cells. (D) Quantification of the MFIs of surface FLT3 level (left) and relative surface-to-total FLT3 level (right) in FLT3-ITD+ AML cells depleted of ZDHHC2 or ZDHHC6 when compared with that of Luc control (n = 3 for each group). (E) WB analysis of signaling transduction in 2 FLT3-ITD+ patient AML cells depleted of ZDHHC2 or ZDHHC6 vs Luc. (F) Cell growth of FLT3-ITD+ patient AML cells upon depletion of ZDHHC2 or ZDHHC6 as in panel D. (G) Relative colony-forming capacity of 3 individual FLT3-ITD+ patient AML cells with depletion of ZDHHC2 or ZDHHC6 vs Luc. All relevant data are presented as means ± standard deviation. (C-D) Each symbol represents individual patient AML cells. (F-G) Data analyses were performed in triplicate. In all relevant panels, *P < .05; **P < .01; ns, not significant, as determined by 2-tailed Student t test.
Figure 6.
Figure 6.
Depalmitoylation inhibitor synergizes with gilteritinib in restraining FLT3-ITD–mediated signaling and leukemia cell growth. (A) Cell growth curves of different leukemia cell lines in a graded dose of the depalmitoylation inhibitor palm B. Cells were grown in triplicate for 3 days; relative MTT values are shown. MV4;11: FLT3-ITD homozygous; MOLM13: FLT3-ITD heterozygous; CMK and SEMK2: FLT3-WT; K562: FLT3. (B) MV4;11 cells were pretreated with DMSO, 60 μM palm B alone, 2 nM gilteritinib alone, or dual drugs for 6 hours, followed by xenotransplantation into sublethally irradiated NSG mice. Bioluminescence imaging at 2 weeks after xenograft is shown. (C) Quantification of bioluminescence signals as in panel B. DMSO (n = 5), palm B alone (n = 7), gilteritinib alone (n = 7), or dual drugs (n = 5). (D) Representative flow cytometric plots of surface FLT3 levels in FLT3-WT and FLT3-ITD+ AMLs, with or without 60 μM palm B treatment. (E) Quantification of surface FLT3 level as in panel D. FLT3-WT (n = 4) and FLT3-ITD+ patients with AML (n = 4). (F) Primary FLT3-WT and FLT3-ITD+ AML cells were grown in triplicate for 3 days in media containing graded concentrations of palm B. Cell growth was examined by MTT assay. (G) Primary FLT3-ITD+ AML cells were grown in triplicate for 3 days in the presence of various concentrations of palm B or gilteritinib, followed by MTT analysis. Drug synergy scoring calculated by CompuSyn software is shown. CI<1, synergism; CI = 1, additive effect; CI>1, antagonism. (H) Colony numbers of primary FLT3-ITD+ AML cells plated in triplicate in various concentrations of gilteritinib in the presence or absence of palm B. (I) Examination of FLT3-ITD downstream signaling in primary FLT3-ITD+ AML cells treated with the indicated doses of palm B, gilteritinib, or dual drugs. (A,F) Data in are presented as means ± SD. Statistics of the FLT3-WT and FLT3-ITD+ groups in panels A and F were first examined by 2-way analysis of variance (###P < .001), followed by Bonferroni post hoc tests for individual doses. *P < .05; **P < .01; ***P < .001. (C,E) Data are presented as means ± standard error of the mean. (C,E) Each symbol represents an individual mouse or patient AML sample. (H) Data are presented as means ± standard deviation. (H) *Comparison of different concentrations of gilteritinib to 0 nM gilteritinib in the respective DMSO or palm B group. #Comparison of the DMSO and palm B groups in the presence of the same concentration of gilteritinib. In all relevant panels, * ,** or ##P < .01; *** or ###P < .001, as determined by 2-tailed Student t test. CI, combination index; MTT, 3-[4,5-dimethylthiazol-2-yl]-2,5-diphenyltetrazolium bromide.

Comment in

Similar articles

Cited by

References

    1. Daver N, Schlenk RF, Russell NH, Levis MJ.. Targeting FLT3 mutations in AML: review of current knowledge and evidence. Leukemia. 2019;33(2):299-312. - PMC - PubMed
    1. Port M, Böttcher M, Thol F, et al. . Prognostic significance of FLT3 internal tandem duplication, nucleophosmin 1, and CEBPA gene mutations for acute myeloid leukemia patients with normal karyotype and younger than 60 years - a systematic review and meta-analysis. Ann Hematol. 2014;93(8):1279-1286. - PubMed
    1. Bacher U, Haferlach C, Kern W, Haferlach T, Schnittger S.. Prognostic relevance of FLT3-TKD mutations in AML: the combination matters--an analysis of 3082 patients. Blood. 2008;111(5):2527-2537. - PubMed
    1. Hayakawa F, Towatari M, Kiyoi H, et al. . Tandem-duplicated Flt3 constitutively activates STAT5 and MAP kinase and introduces autonomous cell growth in IL-3-dependent cell lines. Oncogene. 2000;19(5):624-631. - PubMed
    1. Spiekermann K, Bagrintseva K, Schwab R, Schmieja K, Hiddemann W.. Overexpression and constitutive activation of FLT3 induces STAT5 activation in primary acute myeloid leukemia blast cells. Clin Cancer Res. 2003; 9(6):2140-2150. - PubMed

Publication types

Substances