. 2021 Jun 16;13(598):eabe9599.
doi: 10.1126/scitranslmed.abe9599. Epub 2021 Jun 8.

Plasma from patients with bacterial sepsis or severe COVID-19 induces suppressive myeloid cell production from hematopoietic progenitors in vitro

Affiliations

Plasma from patients with bacterial sepsis or severe COVID-19 induces suppressive myeloid cell production from hematopoietic progenitors in vitro

Miguel Reyes et al. Sci Transl Med. .

Abstract

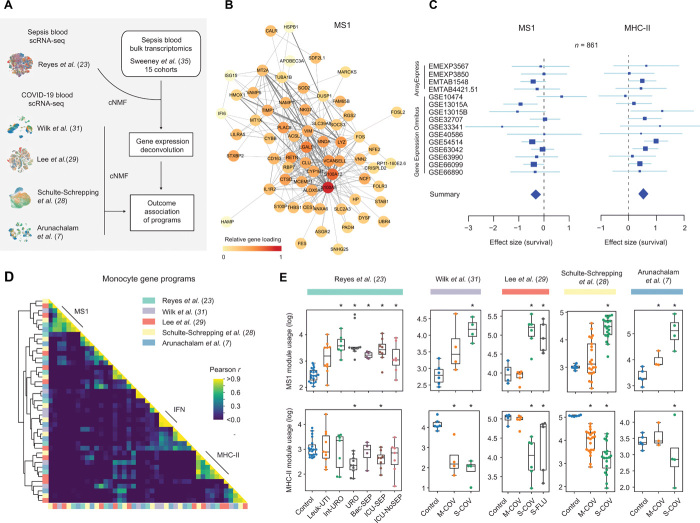
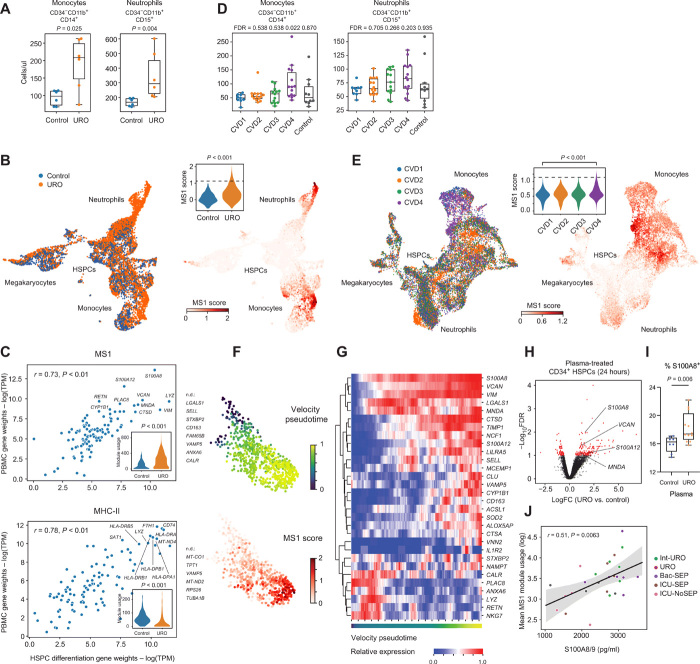
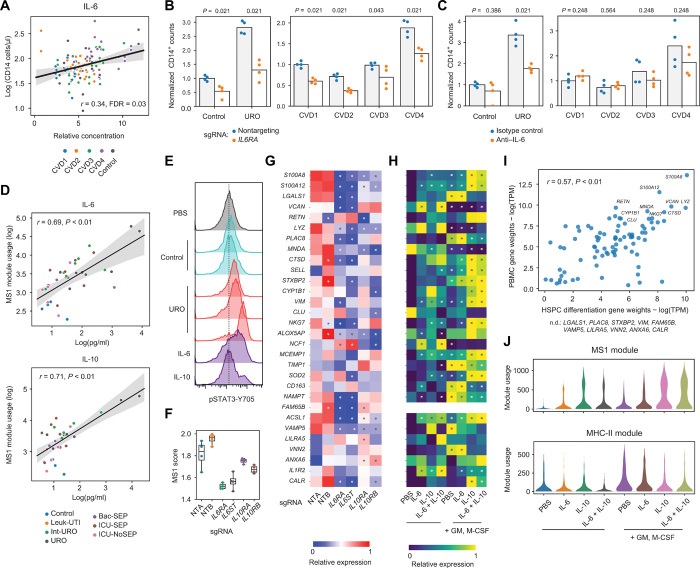
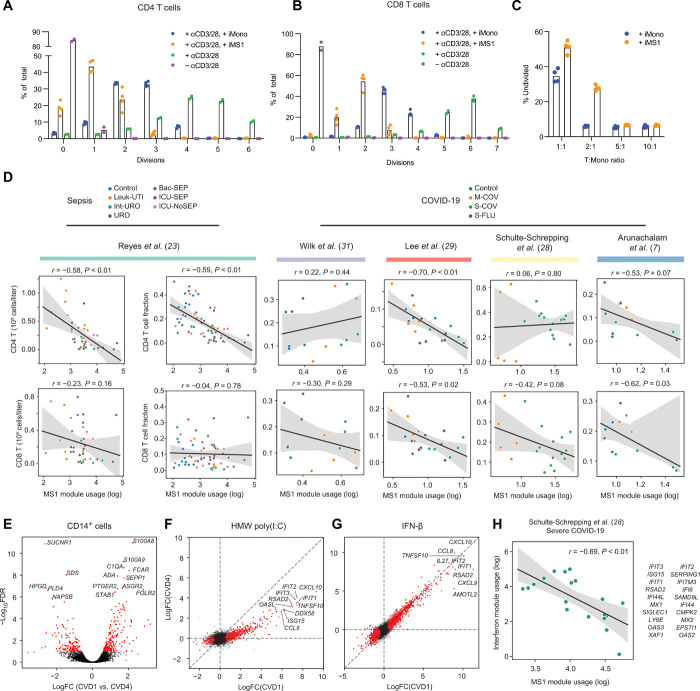
Bacterial sepsis and severe COVID-19 share similar clinical manifestations and are both associated with dysregulation of the myeloid cell compartment. We previously reported an expanded CD14+ monocyte state, MS1, in patients with bacterial sepsis and validated expansion of this cell subpopulation in publicly available transcriptomics data. Here, using published datasets, we show that the gene expression program associated with MS1 correlated with sepsis severity and was up-regulated in monocytes from patients with severe COVID-19. To examine the ontogeny and function of MS1 cells, we developed a cellular model for inducing CD14+ MS1 monocytes from healthy bone marrow hematopoietic stem and progenitor cells (HSPCs). We found that plasma from patients with bacterial sepsis or COVID-19 induced myelopoiesis in HSPCs in vitro and expression of the MS1 gene program in monocytes and neutrophils that differentiated from these HSPCs. Furthermore, we found that plasma concentrations of IL-6, and to a lesser extent IL-10, correlated with increased myeloid cell output from HSPCs in vitro and enhanced expression of the MS1 gene program. We validated the requirement for these two cytokines to induce the MS1 gene program through CRISPR-Cas9 editing of their receptors in HSPCs. Using this cellular model system, we demonstrated that induced MS1 cells were broadly immunosuppressive and showed decreased responsiveness to stimulation with a synthetic RNA analog. Our in vitro study suggests a potential role for systemic cytokines in inducing myelopoiesis during severe bacterial or SARS-CoV-2 infection.


Figures

Fig. 1
Fig. 1. The MS1 gene expression program is associated with disease severity in bacterial sepsis and COVID-19.
(A) Shown is the analysis scheme for 5 scRNA-seq datasets and 15 bulk transcriptomics datasets from cohorts of patients with bacterial sepsis or COVID-19. (B) Shown is a correlation network for the MS1 gene expression program in monocytes from patients with bacterial sepsis. Edge thickness is proportional to the correlation value between each pair of genes. Node colors are proportional to the expression level in log(transcripts per million) of each gene in the program. (C) Forest plots indicate the effect size on patient survival (log2 standardized mean difference) of inferred MS1 (left) or MHC-II (right) gene expression program usage in each dataset (patient cohort) from bulk gene expression deconvolution. Accession numbers for the data from each dataset are listed on the left. Blue boxes indicate the effect size in an individual study, with whiskers extending to the 95% confidence interval. Size of the box is proportional to the relative sample size of the study. Blue diamonds represent the summary effect size among the patient groups, determined by integrating the standardized mean differences across all studies. The width of the diamond corresponds to its 95% confidence interval. (D) Correlation matrix of the gene weights (z scores) for the monocyte gene expression programs across five scRNA-seq datasets for cohorts of patients with bacterial sepsis or COVID-19 is presented (table S7) (7, 23, 28, 29, 31). Gene expression modules were derived in an unbiased manner from each dataset using consensus non-negative matrix factorization (cNMF). (E) Mean usage (log) of the MS1 (top) and MHC-II (bottom) gene expression programs in monocytes from each patient across patient groups for each dataset (cohort) is shown. Asterisks indicate a false discovery rate (FDR) < 0.05, computed by comparing each disease state with that of healthy controls (two-tailed Wilcoxon rank sum test, corrected for testing of multiple modules). Boxes show the median and interquartile range (IQR) for each patient cohort, with whiskers extending to 1.5 IQR in either direction from the top or bottom quartile. Detailed descriptions of the patient cohorts and numbers of cells and patients for each of the five datasets in (D) and (E) are described in the corresponding publications (7, 23, 28, 29, 31) and in table S7. Control, healthy controls; Leuk-UTI, urinary tract infection with leukocytosis; Int-URO, intermediate urosepsis; URO, urosepsis; Bac-SEP, sepsis with confirmed bacteremia; ICU-SEP, intensive care with sepsis; ICU-NoSEP, intensive care without sepsis; M-COV, mild COVID-19; S-COV, severe COVID-19; S-FLU, severe influenza A.
Fig. 2
Fig. 2. Sepsis and COVID-19 plasma samples induce myeloid differentiation of HSPCs and MS1 gene program expression in monocytes.
(A) Shown is the number of CD34CD11b+CD14+ (left) and CD34CD11b+CD15+ (right) myeloid cells produced after incubation of CD34+ HSPCs in vitro with control plasma or plasma from patients with urosepsis for 7 days. Six experiments were performed for each condition in (A) (three plasma donors with two technical replicates). P values were calculated using a two-tailed Wilcoxon rank sum test. (B) Shown are uniform manifold approximation and projection (UMAP) projections of scRNA-seq data from the experiment with HSPCs incubated with urosepsis plasma shown in (A). Colors indicate the plasma pool with which the CD34+ HSPCs were treated (left) or the MS1 gene expression score for each cell (right). Major immune cell types are labeled on the basis of expression of known marker genes. The experiment in (B) was performed on CD34+ HSPCs from two healthy bone marrow donors with two plasma donors for each condition; a total of 3039 and 5254 cells were profiled for the control plasma and urosepsis plasma treatment, respectively. (C) Gene weight correlations between the MS1 gene expression program (top) or MHC-II gene expression program (bottom) in experiments with HSPCs incubated with urosepsis plasma (x axis) and in PBMCs from patients with sepsis (y axis) are shown. Significance of the correlations (Pearson r) was calculated with a permutation test. Genes that were not detected (n.d.) in the HSPC-plasma incubation experiment but were among the top 30 genes for the corresponding gene program in the PBMC dataset are indicated. Insets show violin plots of gene program usage across different plasma treatment conditions. TPM, transcripts per million. (D) Shown is the number of CD34CD11b+CD14+ (left) and CD34CD11b+CD15+ (right) myeloid cells produced after 7 days of incubation of CD34+ HSPCs with plasma from patients that were not infected (Control, n = 10 patients) or infected with SARS-CoV-2 [CVD1 (n = 9), non-hospitalized; CVD2 (n = 14), hospitalized; CVD3 (n = 14), ICU; CVD4 (n = 10), deceased]. FDR values are shown when comparing plasma for each disease state to mild COVID-19 (CVD1) patient plasma (two-tailed Wilcoxon rank sum test, corrected for testing of multiple cohorts). (E) Shown are UMAP projections of scRNA-seq data from experiments incubating CD34+ HSPCs with COVID-19 plasma. Colors indicate the plasma pool with which the CD34+ HSPCs were treated (left) or the MS1 gene expression score for each cell (right). Major immune cell types are labeled on the basis of expression of known marker genes. The experiment in (E) was performed with HSPCs from two healthy bone marrow donors using pooled plasma from all donors in (D); a total of 4449, 4591, 3129, and 3711 cells were profiled after incubation of HSPCs with plasma from patients with mild to severe COVID-19, respectively. Inset shows violin plots of MS1 gene expression scores for CD14-expressing cells from each plasma treatment condition. Dashed line indicates the mean MS1 score in cells from the MS1 cluster in the PBMC dataset (23). (F) Shown is a UMAP projection of the MS1 cell cluster differentiating from CD34+ HSPCs in vitro. Cells are colored by relative RNA velocity pseudotime (top) (70), which is derived from the ratio of spliced and unspliced transcripts in the scRNA-seq dataset, and MS1 score (bottom). (G) A clustered heatmap of the top 30 genes in the MS1 module is presented. Columns indicate individual cells ordered by velocity pseudotime. Expression values are z score normalized for each gene. (H) Volcano plot shows differential gene expression analysis (exact test) between CD34+ HSPCs treated with control or urosepsis plasma for 24 hours. Genes with FDR of <0.1 are highlighted in red, and selected genes that are up-regulated early in the MS1 gene expression program are labeled. Four experiments were performed for each condition (two plasma donors with two technical replicates). (I) Quantitation of S100A8 intracellular staining of CD34+ HSPCs treated with control or urosepsis plasma for 24 hours is shown. Four experiments were performed with six donors for control and urosepsis plasma, with two technical replicates for each plasma sample. (J) Shown is the correlation between S100A8/9 concentrations in plasma and MS1 gene expression for plasma samples from patients with urosepsis and controls (n = 28). Line and shadow indicate linear regression fit and 95% confidence interval, respectively. Significance of the correlation (Pearson r) was calculated with a two-sided permutation test.
Fig. 3
Fig. 3. MS1 gene expression program induction in CD34+ HSPCs depends on IL-6 and IL-10.
(A) Shown is the correlation between relative IL-6 concentrations in plasma from patients with COVID-19 and controls (normalized to total protein expression) and the production of CD34, CD11b+, CD14+ monocytic cells after incubation of HSPCs with plasma from patients with COVID-19 (n = 51) or controls (n = 10). Line and shadow indicate linear regression fit and 95% confidence interval, respectively. Significance of the correlation (Pearson r) was calculated with a two-sided permutation test that was corrected for testing of multiple cytokines. (B) Shown is the CD34, CD11b+, CD14+ monocytic cell production after incubation of CD34+ HSPCs in vitro with COVID-19 patient plasma (CVD1 to CVD4), urosepsis plasma, or control plasma for 7 days. HSPCs were electroporated with Cas9 ribonucleoproteins complexed with single guide RNAs (sgRNAs) targeting IL6RA or nontargeting (control). CD14+ cell counts are normalized to the mean of either the control (left) or mild COVID-19 (right) plasma condition for each bone marrow donor. (C) Shown is CD34, CD11b+, CD14+ monocytic cell production after incubation of CD34+ HSPCs with COVID-19 plasma (CVD1 to CVD4), urosepsis plasma, or control plasma for 7 days in medium containing anti–IL-6 antibody or isotype antibody control. CD14+ cell counts are normalized to either the control (left) or mild COVID-19 (right) plasma condition for each bone marrow donor. Experiments in (B) and (C) were performed with HSPCs from two bone marrow donors with two technical replicates each, using pooled plasma from five independent patients or controls for each plasma condition. P values are calculated using a two-tailed Wilcoxon rank sum test. (D) Correlations between IL-6 (top) and IL-10 (bottom) concentrations in plasma and expression of the MS1 gene expression program are shown for 40 patients with sepsis and controls. Line and shadow indicate linear regression fit and 95% confidence interval, respectively. Significance of the correlations (Pearson r) was calculated with a two-sided permutation test. (E) Quantification of intracellular staining for phosphorylated STAT3 (Y705) in CD34+ HSPCs treated with control or urosepsis plasma or with IL-6 or IL-10 (100 ng/ml) is shown. Dashed line indicates median fluorescence for PBS-treated HSPCs. Results are representative of two independent experiments using different bone marrow donors. (F) MS1 gene expression scores were calculated from bulk RNA-seq of sorted CD14+ cells generated from CD34+ HSPCs electroporated with Cas9 ribonucleoproteins and treated with plasma from patients with urosepsis for 7 days. (G) Shown is expression of the top 30 MS1 genes in sorted CD14+ cells generated from CD34+ HSPCs electroporated with Cas9 ribonucleoproteins and treated with plasma from patients with urosepsis for 7 days. Asterisks indicate a significant difference (FDR < 0.1; Wilcoxon rank sum test, corrected for testing of multiple genes) compared with nontargeting guide RNA (NTA). In (F) and (G), n = 4 experiments were performed for each guide RNA condition (two biological and two technical replicates). (H) Expression of the top 30 MS1 genes from scRNA-seq data from CD14+ monocytic cells generated from CD34+ HSPCs treated with the indicated cytokines (all at 100 ng/ml) is shown. Asterisks indicate a significant difference (FDR < 0.1; Wilcoxon rank sum test, corrected for testing of multiple genes) compared with the PBS control. (I) Shown is the gene weight correlation between the MS1 gene expression program detected in the cytokine treatment (x axis) and patient PBMC datasets (y axis). Significance of the Pearson correlations (r) was calculated with a permutation test. Genes that were not detected in the cytokine treatment dataset but were among the top 30 genes in the PBMC dataset are indicated. (J) Violin plots show MS1 (top) and MHC-II (bottom) gene expression programs in CD14+ monocytic cells across the different cytokine treatments. The experiments in (H) to (J) were performed on HSPCs from two bone marrow donors for each cytokine treatment; a total of 3365, 2986, 2550, 3025, 3194, 3061, 2850, and 2918 cells for each cytokine treatment were profiled.
Fig. 4
Fig. 4. MS1 cells generated from HSPCs in vitro are immunosuppressive.
(A and B) Shown is the number of divisions (after 4 days in culture) of (A) CD4 T cells and (B) CD8 T cells activated with anti-CD3 and anti-CD28 antibodies in vitro and incubated 1:1 with either iMono or iMS1 cells (induced by cytokines) generated from CD34+ HSPCs. Percentages are determined by CFSE (carboxyfluorescein diacetate succinimidyl ester) dilution and flow cytometry. (C) Fraction of nondividing CD4 T cells activated with anti-CD3 and anti-CD28 antibodies and co-incubated with either iMono or iMS1 cells at different ratios. In (A) to (C), four experiments were performed for each condition (two bone marrow donors, each with two technical replicates). (D) Scatterplots indicate the correlation between mean MS1 gene expression usage in monocytes and absolute abundance or fraction of (top) CD4 T cells or (bottom) CD8 T cells for each patient with bacterial sepsis (23) or COVID-19 (7, 28, 29, 31) (each dot represents one patient). Line and shadow indicate linear regression fit and 95% confidence interval, respectively. Significance of the correlation (Pearson r) was calculated with a two-sided permutation test. (E) Volcano plot showing differential gene expression analysis results (exact test) between CD14+ cells generated from HSPCs in vitro in response to pooled plasma from patients with mild (CVD1) or severe (CVD4) COVID-19. Genes with FDR of <0.1 are in red and >0.1 are in black, and the top 15 genes with lowest FDR values are shown. (F and G) Scatterplots show the log2 fold change (FC) for each gene after high–molecular weight (HMW) poly-(I:C) (F) or IFN-β (G) treatment of CD14+ cells generated from HSPCs in vitro using pooled plasma from patients with mild (CVD1) COVID-19 on the x axis or severe COVID-19 (CVD4) on the y axis. Genes with FDR < 0.1 in CVD1 plasma-generated CD14+ cells are shown in red, and the top 10 genes with the highest fold change values are indicated. In (E) to (G), four experiments were performed for each condition (two bone marrow donors with two technical replicates). (H) Correlation between the IFN response and MS1 module usage in CD14+ monocytes from patients with severe COVID-19 is shown. Line and shadow indicate linear regression fit and 95% confidence interval, respectively. Significance of the correlation (Pearson r) was calculated with a two-sided permutation test. The top 20 genes associated with the IFN response are listed on the right.

Update of

Similar articles

Cited by

References

    1. Rudd K. E., Johnson S. C., Agesa K. M., Shackelford K. A., Tsoi D., Kievlan D. R., Colombara D. V., Ikuta K. S., Kissoon N., Finfer S., Fleischmann-Struzek C., Machado F. R., Reinhart K. K., Rowan K., Seymour C. W., Watson R. S., West T. E., Marinho F., Hay S. I., Lozano R., Lopez A. D., Angus D. C., Murray C. J. L., Naghavi M., Global, regional, and national sepsis incidence and mortality, 1990-2017: Analysis for the Global Burden of Disease Study. Lancet 395, 200–211 (2020). - PMC - PubMed
    1. Filbin M. R., Lynch J., Gillingham T. D., Thorsen J. E., Pasakarnis C. L., Nepal S., Matsushima M., Rhee C., Heldt T., Reisner A. T., Presenting symptoms independently predict mortality in septic shock: Importance of a previously unmeasured confounder. Crit. Care Med. 46, 1592–1599 (2018). - PubMed
    1. Scicluna B. P., Baillie J. K., The search for efficacious new therapies in sepsis needs to embrace heterogeneity. Am. J. Respir. Crit. Care Med. 199, 936–938 (2019). - PMC - PubMed
    1. van der Poll T., van de Veerdonk F. L., Scicluna B. P., Netea M. G., The immunopathology of sepsis and potential therapeutic targets. Nat. Rev. Immunol. 17, 407–420 (2017). - PubMed
    1. Alhazzani W., Møller M. H., Arabi Y. M., Loeb M., Gong M. N., Fan E., Oczkowski S., Levy M. M., Derde L., Dzierba A., Du B., Aboodi M., Wunsch H., Cecconi M., Koh Y., Chertow D. S., Maitland K., Alshamsi F., Belley-Cote E., Greco M., Laundy M., Morgan J. S., Kesecioglu J., McGeer A., Mermel L., Mammen M. J., Alexander P. E., Arrington A., Centofanti J. E., Citerio G., Baw B., Memish Z. A., Hammond N., Hayden F. G., Evans L., Rhodes A., Surviving sepsis campaign: Guidelines on the management of critically ill adults with coronavirus disease 2019 (COVID-19). Crit. Care Med. 48, e440–e469 (2020). - PMC - PubMed

Publication types