Aging- and Tumor-Mediated Increase in CD8+CD28- T Cells Might Impose a Strong Barrier to Success of Immunotherapy in Glioblastoma
- PMID: 34103370
- PMCID: PMC8591704
- DOI: 10.4049/immunohorizons.2100008
Aging- and Tumor-Mediated Increase in CD8+CD28- T Cells Might Impose a Strong Barrier to Success of Immunotherapy in Glioblastoma
Abstract
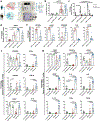
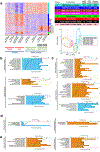
Clinical use of various forms of immunotherapeutic drugs in glioblastoma (GBM), has highlighted severe T cell dysfunction such as exhaustion in GBM patients. However, reversing T cell exhaustion using immune checkpoint inhibitors in GBM clinical trials has not shown significant overall survival benefit. Phenotypically, CD8+ T cells with downregulated CD28 coreceptors, low CD27 expression, increased CD57 expression, and telomere shortening are classified as senescent T cells. These senescent T cells are normally seen as part of aging and also in many forms of solid cancers. Absence of CD28 on T cells leads to several functional irregularities including reduced TCR diversity, incomplete activation of T cells, and defects in Ag-induced proliferation. In the context of GBM, presence and/or function of these CD8+CD28- T cells is unknown. In this clinical correlative study, we investigated the effect of aging as well as tumor microenvironment on CD8+ T cell phenotype as an indicator of its function in GBM patients. We systematically analyzed and describe a large population of CD8+CD28- T cells in both the blood and tumor-infiltrating lymphocytes of GBM patients. We found that phenotypically these CD8+CD28- T cells represent a distinct population compared with exhausted T cells. Comparative transcriptomic and pathway analysis of CD8+CD28- T cell populations in GBM patients revealed that tumor microenvironment might be influencing several immune related pathways and thus further exaggerating the age associated immune dysfunction in this patient population.
Copyright © 2021 The Authors.
Conflict of interest statement
Conflict of Interest Statement
Authors have declared that no conflict of interest exists.
Figures


Similar articles
-
TIGIT and PD-1 Immune Checkpoint Pathways Are Associated With Patient Outcome and Anti-Tumor Immunity in Glioblastoma.Front Immunol. 2021 May 7;12:637146. doi: 10.3389/fimmu.2021.637146. eCollection 2021. Front Immunol. 2021. PMID: 34025646 Free PMC article.
-
Nivolumab Reaches Brain Lesions in Patients with Recurrent Glioblastoma and Induces T-cell Activity and Upregulation of Checkpoint Pathways.Cancer Immunol Res. 2024 Sep 3;12(9):1202-1220. doi: 10.1158/2326-6066.CIR-23-0959. Cancer Immunol Res. 2024. PMID: 38885356 Free PMC article.
-
Anti-PD-1 Induces M1 Polarization in the Glioma Microenvironment and Exerts Therapeutic Efficacy in the Absence of CD8 Cytotoxic T Cells.Clin Cancer Res. 2020 Sep 1;26(17):4699-4712. doi: 10.1158/1078-0432.CCR-19-4110. Epub 2020 Jun 18. Clin Cancer Res. 2020. PMID: 32554515 Free PMC article.
-
Crosstalk Between Tumor-Associated Microglia/Macrophages and CD8-Positive T Cells Plays a Key Role in Glioblastoma.Front Immunol. 2021 Jul 29;12:650105. doi: 10.3389/fimmu.2021.650105. eCollection 2021. Front Immunol. 2021. PMID: 34394072 Free PMC article. Review.
-
The Evolving Role of CD8+CD28- Immunosenescent T Cells in Cancer Immunology.Int J Mol Sci. 2019 Jun 8;20(11):2810. doi: 10.3390/ijms20112810. Int J Mol Sci. 2019. PMID: 31181772 Free PMC article. Review.
Cited by
-
Pathway analysis of peripheral blood CD8+ T cell transcriptome shows differential regulation of sphingolipid signaling in multiple sclerosis and glioblastoma.PLoS One. 2024 Jun 11;19(6):e0305042. doi: 10.1371/journal.pone.0305042. eCollection 2024. PLoS One. 2024. PMID: 38861512 Free PMC article.
-
CDKN2 expression is a potential biomarker for T cell exhaustion in hepatocellular carcinoma.BMB Rep. 2024 Jun;57(6):287-292. doi: 10.5483/BMBRep.2023-0214. BMB Rep. 2024. PMID: 38523373 Free PMC article.
-
Challenges in glioblastoma immunotherapy: mechanisms of resistance and therapeutic approaches to overcome them.Br J Cancer. 2022 Oct;127(6):976-987. doi: 10.1038/s41416-022-01864-w. Epub 2022 Jun 4. Br J Cancer. 2022. PMID: 35662275 Free PMC article. Review.
-
Ascitic Senescent T Cells Are Linked to Chemoresistance in Patients With Advanced High-Grade Serous Ovarian Cancer.Front Oncol. 2022 Jul 7;12:864021. doi: 10.3389/fonc.2022.864021. eCollection 2022. Front Oncol. 2022. PMID: 35875098 Free PMC article.
-
Senescent Tumor Cells in the Peritoneal Carcinomatosis Drive Immunosenescence in the Tumor Microenvironment.Front Immunol. 2022 Jun 30;13:908449. doi: 10.3389/fimmu.2022.908449. eCollection 2022. Front Immunol. 2022. PMID: 35844581 Free PMC article.
References
-
- Jordan, D. of N., Jordan University Hospital and Medical School, University of Jordan, Amman, TAMIMI AF, JUWEID M & Jordan, D. of R. and N. M., Jordan University Hospital and Medical School, University of Jordan, Amman,. Glioblastoma. 143–153 (2017). doi:10.15586/codon.glioblastoma.2017.ch8 - DOI
-
- Lim M, Xia Y, Bettegowda C & Weller M Current state of immunotherapy for glioblastoma. Nat Rev Clin Oncol 15, 422–442 (2018). - PubMed
Publication types
MeSH terms
Substances
Grants and funding
LinkOut - more resources
Full Text Sources
Medical
Molecular Biology Databases
Research Materials

