. 2021 Jul 14;41(28):5980-5993.
doi: 10.1523/JNEUROSCI.3150-20.2021.

Munc18-1 Is Essential for Neuropeptide Secretion in Neurons

Affiliations

Munc18-1 Is Essential for Neuropeptide Secretion in Neurons

Daniël C Puntman et al. J Neurosci. .

Abstract

Neuropeptide secretion from dense-core vesicles (DCVs) controls many brain functions. Several components of the DCV exocytosis machinery have recently been identified, but the participation of a SEC1/MUNC18 (SM) protein has remained elusive. Here, we tested the ability of the three exocytic SM proteins expressed in the mammalian brain, MUNC18-1/2/3, to support neuropeptide secretion. We quantified DCV exocytosis at a single vesicle resolution on action potential (AP) train-stimulation in mouse CNS neurons (of unknown sex) using pHluorin-tagged and/or mCherry-tagged neuropeptide Y (NPY) or brain-derived neurotrophic factor (BDNF). Conditional inactivation of Munc18-1 abolished all DCV exocytosis. Expression of MUNC18-1, but not MUNC18-2 or MUNC18-3, supported DCV exocytosis in Munc18-1 null neurons. Heterozygous (HZ) inactivation of Munc18-1, as a model for reduced MUNC18-1 expression, impaired DCV exocytosis, especially during the initial phase of train-stimulation, when the release was maximal. These data show that neurons critically and selectively depend on MUNC18-1 for neuropeptide secretion. Impaired neuropeptide secretion may explain aspects of the behavioral and neurodevelopmental phenotypes that were observed in Munc18-1 HZ mice.SIGNIFICANCE STATEMENT Neuropeptide secretion from dense-core vesicles (DCVs) modulates synaptic transmission, sleep, appetite, cognition and mood. However, the mechanisms of DCV exocytosis are poorly characterized. Here, we identify MUNC18-1 as an essential component for neuropeptide secretion from DCVs. Paralogs MUNC18-2 or MUNC18-3 cannot compensate for MUNC18-1. MUNC18-1 is the first protein identified to be essential for both neuropeptide secretion and synaptic transmission. In heterozygous (HZ) Munc18-1 neurons, that have a 50% reduced MUNC18-1expression and model the human STXBP1 syndrome, DCV exocytosis is impaired, especially during the initial phase of train-stimulation, when the release is maximal. These data show that MUNC18-1 is essential for neuropeptide secretion and that impaired neuropeptide secretion on reduced MUNC18-1expression may contribute to the symptoms of STXBP1 syndrome.

Keywords: Munc18-1; dense-core vesicle; neuropeptide.


Figures

Figure 1.
Figure 1.
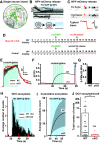
Munc18-1 is essential for DCV exocytosis in neurons. A, Schematic representation of a primary mouse hippocampal neuron grown on a glia microisland. B, The kymograph shows NPY-mCherry fluorescence in an axonal stretch over time. During high-frequency train-stimulation indicated by blue bars (16 trains of 50 APs at 50 Hz), NPY-mCherry release events are visible as an abrupt termination of the line, marked by arrowheads. Below, Schematic model of an NPY-mCherry release event. C, Disappearance of a NPY-mCherry punctum visualized by two still frames: one before and one after the indicated exocytosis event (red arrowhead, same event as in B). The typical trace shows the change in fluorescence (ΔF) over time measured from the indicated exocytosis event. D, Isolated Munc18-1cKO and WT (control) neurons infected at DIV8 with Cre-EGFP were tested for viability (+ = viable, – = non-viable) and for SV exocytosis using Synaptophysin-pHluorin (SypHy). E, Typical Ca2+ traces during high-frequency burst-stimulation (16 trains of 50 APs at 50 Hz, blue bars), obtained using Fluo5-AM, which increases fluorescence on Ca2+ binding, in DIV14–DIV15 Munc18-1cKO (+ Cre-EGFP) and WT (– Cre-EGFP) neurons. F, SV exocytosis assessed using SypHy in Munc18-1 cKO (+ Cre-EGFP) and WT (– Cre-EGFP) neurons. Fluorescence intensity increase reports SV exocytosis. NH4+ is superfused at second 85 (indicated by gray shading) to dequench SypHy fluorescence in all SVs. G, Quantification of F: ΔFMax/Δ NH4+ of SypHy in Munc18-1 cKO and WT neurons. H, Histogram of the average number of DCV exocytosis events over time from non-silent Munc18-1 cKO neurons infected with ΔCre (WT) or Cre (cKO). The blue bars indicate the stimulation paradigm. Sample size excluding silent neurons is visualized as n/N. I, Cumulative representation of the data in D. Error bars are SEM. J, The Tukey/scatter plot shows that the total number of DCV exocytosis events per cell is severely reduced in Munc18-1 cKO neurons (sample size is visualized as n/N). Mann–Whitney U test: **p < 0.01.
Figure 2.
Figure 2.
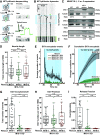
Expression of MUNC18-1, but not MUNC18-2 or MUNC18-3, supports DCV exocytosis in Munc18-1 null neurons. A, left, Model showing the DCV cargo NPY-pHluorin quenched at the low pH inside the vesicle, and de-quenched on vesicular pH elevation during an exocytosis event or NH4+ application. Right, Still frames show an axonal stretch before and during stimulation, and during NH4+ perfusion. The line plots show changes in fluorescence (ΔF) over time measured from the exocytosis events indicated by the green arrows. Scale bar: 5 µm. B, The kymograph shows an axonal stretch over time, visualizing NPY-pHluorin de-quenching events (arrowheads), caused by DCV exocytosis, as well as de-quenching caused by NH4+ (depicted by green-shading at the bottom). High-frequency train-stimulation is indicated with blue bars. The green arrowheads indicate the same exocytosis events as in A. The black arrows indicate other visible exocytosis events. C, Lysates of primary WT neurons, Munc18-1 null (KO) neurons (DIV14–DIV18) or mouse spleen were separated via SDS-PAGE gel electrophoresis and immunoblotted for MUNC18-1 (M18-1), MUNC18-2 (M18-2), or MUNC18-3 (M18-3), and for γ-Tubulin (Tubulin) as loading control. Rescue of Munc18-1 KO neurons (indicated with KO + rescue, third lane) was done with Munc18-1 (top), Munc18-2 (middle), or Munc18-3 (bottom) containing lentivirus particles at DIV0. Ratio indicates intensity of MUNC18-1, MUNC18-2, or MUNC18-3 divided by tubulin, showing that MUNC18-1 rescue levels were higher than WT and that MUNC18-2 rescue levels were higher, while MUNC18-3 rescue levels were lower than endogenous levels in the spleen. D,The Tukey/scatter plot shows that the total neurite length of Munc18-1null neurons rescued with MUNC18-1, MUNC18-2, or MUNC18-3 is similar (same data set as in Fig. 2). Kruskal–Wallis with Dunn's correction: n.s. = non-significant. E, Histogram showing the average number of NPY-pHluorin-labeled DCV exocytosis events in Munc18-1 null neurons rescued with MUNC18-1 (black), MUNC18-2 (green), or MUNC18-3 (brown). Sample size is indicated per condition as n/N. The blue bars indicate the stimulation paradigm. Error bars are SEM. F, Cumulative representation of the data in D. Error bars are SEM. G, The Tukey/scatter plot shows that Munc18-1 null neurons rescued with MUNC18-2 or MUNC18-3 have a strong reduction in the total number of DCV exocytosis events per cell compared with MUNC18-1 rescued neurons. Kruskal–Wallis with Dunn's correction: ***p < 0.001. n.s. = non-significant, p > 0.05. H, The Tukey/scatter plot shows that the total pool of DCVs per cell, revealed by NH4 application, is similar in Munc18-1 null neurons rescued with MUNC18-1, MUNC18-2, or MUNC18-3. Kruskal–Wallis with Dunn's correction: n.s. = non-significant. I, The Tukey/scatter plot shows that in MUNC18-2 or MUNC18-3 rescued neurons, the number of DCV exocytosis events normalized by the poolsize (indicated as release fraction) is strongly reduced. Kruskal–Wallis with Dunn's correction: ***p < 0.001, n.s. = non-significant.
Figure 3.
Figure 3.
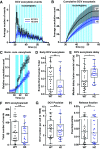
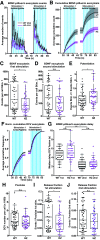
Reduced MUNC18-1 levels decrease DCV exocytosis during the first seconds of stimulation. A, The histogram shows the average number of DCV exocytosis events for Munc18-1 WT (black) and Munc18-1 HZ (blue) neurons over time (sample size is indicated as n/N). Error bars are SEM. B, Cumulative representation of the data in A. Error bars are SEM. WT exocytosis levels varied between experiments, probably because of changes in medium batches. C, Normalized cumulative representation of the data in A during the first seconds of train-stimulation. Error bars are SEM. D, The Tukey/scatter plot shows that the relative DCV exocytosis during the first two trains of stimulation is decreased in Munc18-1 HZ neurons. This was calculated per cell by dividing the number of events during the first two seconds of stimulation by the total number of exocytosis events of that cell. Mann–Whitney test: **p < 0.01. E, The Tukey/scatter plot shows that the median delay of DCV exocytosis events relative to the start of the train-stimulation is larger in Munc18-1 HZ neurons comparted to WT. Mann–Whitney test: *p < 0.05. F, The Tukey/scatter plot shows the number of DCV exocytosis events for Munc18-1 WT and HZ neurons. Mann–Whitney test: n.s. = non-significant. G, The Tukey/scatter plot shows the total number of DCVs, extracted from NH4+superfusion at the end of each recording, for Munc18-1 WT and HZ neurons. Mann–Whitney test: n.s. = non-significant. H, The Tukey/scatter plot shows the number of DCV exocytosis events normalized by the poolsize (release fraction) for Munc18-1 WT and HZ neurons. Mann–Whitney test: n.s. = non-significant.
Figure 4.
Figure 4.
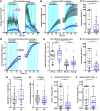
Munc18-1 HZ inactivation reduces exocytosis of NPY-pHluorin-labeled DCVs. A, The histogram shows the average number of DCV exocytosis events for Munc18-1 WT (black) and HZ (blue) neurons that were infected with NPY-pHluorin (sample size is indicated as n/N). The blue bars indicate the two stimulation paradigms (8 times 50 APs at 50 Hz). Error bars are SEM. B, Cumulative representation of the data in A. Error bars are SEM. C, The Tukey/scatter plot shows that the number of DCV exocytosis events per cell during the first train-stimulation is decreased in Munc18-1 HZ neurons. Mann–Whitney U test: ***p < 0.001. In this experiment, Munc18-1 WT neurons had higher absolute numbers of DCV exocytosis compared with those in Figure 3. D, Normalized cumulative representation of the data in A. Error bars are SEM. E, The Tukey/scatter plot shows the median delay of DCV exocytosis events, relative to the start of each train-stimulation, for Munc18-1 WT and HZ neurons. The delay within each train-stimulation is similar between Munc18-1 WT and HZ neurons. During the second train-stimulation, in both WT and HZ neurons, the median delay of exocytosis is decreased compared with the first stimulation. Kruskal–Wallis with Dunn's correction: ***p < 0.001, n.s. = non-significant. F, The Tukey/scatter plot shows that the number of DCV exocytosis events per cell during the second train-stimulation is decreased in Munc18-1 HZ neurons. Mann–Whitney U test: **p < 0.01. G, The Tukey/scatter plot shows that the ratio of the number of exocytosis events between the second and first train-stimulation (potentiation) is higher in Munc18-1 HZ neurons. Mann–Whitney U test: **p < 0.01. H, The Tukey/scatter plot shows that Munc18-1 WT and HZ neurons have a similar total pool of DCVs, as revealed by NH4 application. Mann–Whitney U test: n.s. = non-significant. I, The Tukey/scatter plot shows that the number of DCV exocytosis events normalized by the total pool (indicated as release fraction) was decreased in Munc18-1 HZ neurons during the first train-stimulation. Mann–Whitney U test: **p < 0.01. J, The Tukey/scatter plot shows that the number of DCV exocytosis events normalized by the total pool (indicated as release fraction) was decreased in Munc18-1 HZ neurons during the second train-stimulation. Mann–Whitney U test: *p < 0.01.
Figure 5.
Figure 5.
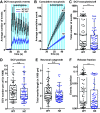
Meta-analysis: Munc18-1 HZ inactivation reduces DCV exocytosis. A, The histogram shows the average number of DCV exocytosis events of Munc18-1 WT (black) and HZ (blue) neurons infected with NPY-pHluorin (sample size is indicated as n/N), during the first eight bursts of high-frequency train-stimulation (combined meta-analysis of datasets from Figs. 3, 4). Error bars are SEM. B, Cumulative representation of the data in A. Error bars are SEM. C, The Tukey/scatter plot shows that the number of DCV exocytosis events is decreased in Munc18-1 HZ neurons during the first eight bursts of high-frequency train-stimulation. Mann–Whitney U test: ***p < 0.001. D, The Tukey/scatter plot shows the total number of DCVs for Munc18-1 WT and HZ neurons, revealed by NH4+superfusion. Mann–Whitney U test: n.s. = non-significant. E, The Tukey/scatter plot shows the total neurite length of Munc18-1 WT and HZ neurons. Mann–Whitney U test: n.s. = non-significant. F, The Tukey/scatter plot shows that the number of DCV exocytosis events normalized by the poolsize (indicated as release fraction) is reduced in Munc18-1 HZ neurons during the first eight bursts of high-frequency train-stimulation. Mann–Whitney U test: p < 0.001.
Figure 6.
Figure 6.
HZ inactivation of Munc18-1 reduces exocytosis of BDNF-pHluorin-labeled DCVs. A, The histogram shows the average number of DCV exocytosis events for Munc18-1 WT (black) and HZ (magenta) neurons infected with BDNF-pHluorin (sample size is indicated as n/N). The blue bars indicate the two stimulation paradigms (8 times 50 APs at 50 Hz). Error bars are SEM. B, Cumulative representation of the data in A. Error bars are SEM. C, The Tukey/scatter plot shows that the total number of DCV exocytosis events during the first train-stimulation is decreased in Munc18-1 HZ neurons. Mann–Whitney U test: *p < 0.05. D, The Tukey/scatter plot shows the total number of DCV exocytosis events during the second train-stimulation for Munc18-1 WT and HZ neurons. Mann–Whitney U test: n.s. = non-significant. E, The Tukey/scatter plot shows that the ratio of the number of exocytosis events between the second and first train-stimulation (potentiation) is higher in Munc18-1 HZ neurons. Mann–Whitney U test: *p < 0.05. F, Normalized cumulative representation of the data in A. Error bars are SEM. G, The Tukey/scatter plot shows the median delay of BDNF-pHluorin-labeled DCV exocytosis events relative to the start of each train-stimulation for Munc18-1 WT and HZ neurons. The delay within each train-stimulation is similar between Munc18-1 WT and HZ neurons. In both WT and HZ neurons, the median delay of exocytosis is decreased during the second train-stimulation compared with the first. Kruskal–Wallis with Dunn's correction: ***p < 0.001, n.s. = non-significant. H, The Tukey/scatter plot shows that the total pool of DCVs per cell, revealed by NH4 application, is similar for Munc18-1 WT and HZ neurons. Mann–Whitney U test: ns = non-significant. I, The Tukey/scatter plot shows that the number of DCV exocytosis events normalized by the total pool (indicated as release fraction) is decreased in Munc18-1 HZ neurons during the first train-stimulation. Mann–Whitney U test: *p < 0.05. J, The Tukey/scatter plot shows the number of DCV exocytosis events normalized by the total pool (indicated as release fraction) for Munc18-1 WT and HZ neurons during the second train-stimulation. Mann–Whitney U test: n.s. = non-significant.

Similar articles

Cited by

References

    1. Aalto MK, Ronne H, Keränen S (1993) Yeast syntaxins Sso1p and Sso2p belong to a family of related membrane proteins that function in vesicular transport. EMBO J 12:4095–4104. - PMC - PubMed
    1. Abramov D, Guiberson NGL, Burré J (2020) STXBP1 encephalopathies: clinical spectrum, disease mechanisms, and therapeutic strategies. J Neurochem 157:165–178. - PMC - PubMed
    1. André T, Classen J, Brenner P, Betts MJ, Dörr B, Kreye S, Zuidinga B, Meijer M, Russell RB, Verhage M, Söllner TH (2020) The interaction of Munc18-1 helix 11 and 12 with the central region of the VAMP2 SNARE motif is essential for SNARE templating and synaptic transmission. eNeuro 7:ENEURO.0278-20.2020. 10.1523/ENEURO.0278-20.2020 - DOI - PMC - PubMed
    1. Arora S, Saarloos I, Kooistra R, van de Bospoort R, Verhage M, Toonen RF (2017) SNAP-25 gene family members differentially support secretory vesicle fusion. J Cell Sci 130:1877–1889. 10.1242/jcs.201889 - DOI - PubMed
    1. Bin NR, Jung CH, Piggott C, Sugita S (2013) Crucial role of the hydrophobic pocket region of Munc18 protein in mast cell degranulation. Proc Natl Acad Sci USA 110:4610–4615. 10.1073/pnas.1214887110 - DOI - PMC - PubMed

LinkOut - more resources