. 2021 Jun 7;17(6):e1009146.
doi: 10.1371/journal.pgen.1009146. eCollection 2021 Jun.

Crumbs and the apical spectrin cytoskeleton regulate R8 cell fate in the Drosophila eye

Affiliations

Crumbs and the apical spectrin cytoskeleton regulate R8 cell fate in the Drosophila eye

Jonathan M Pojer et al. PLoS Genet. .

Abstract

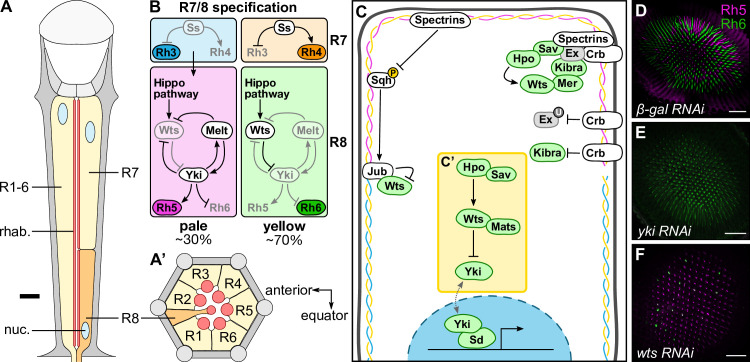
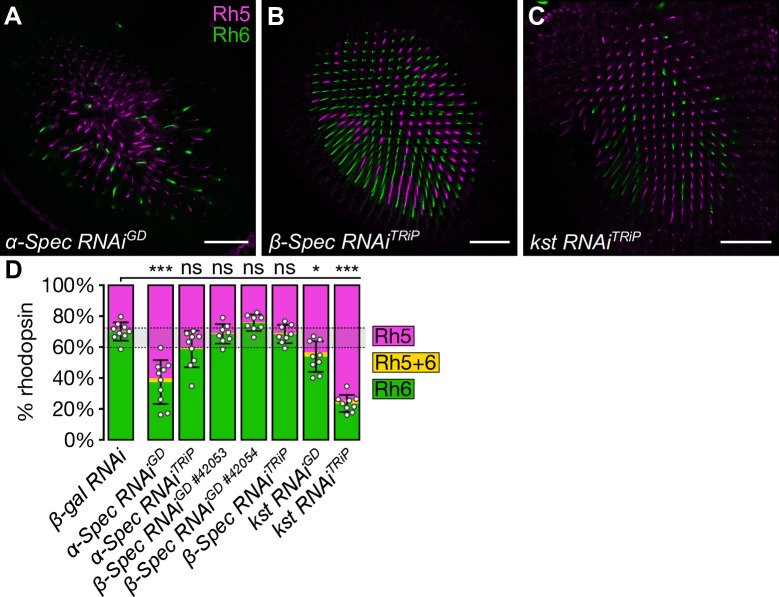
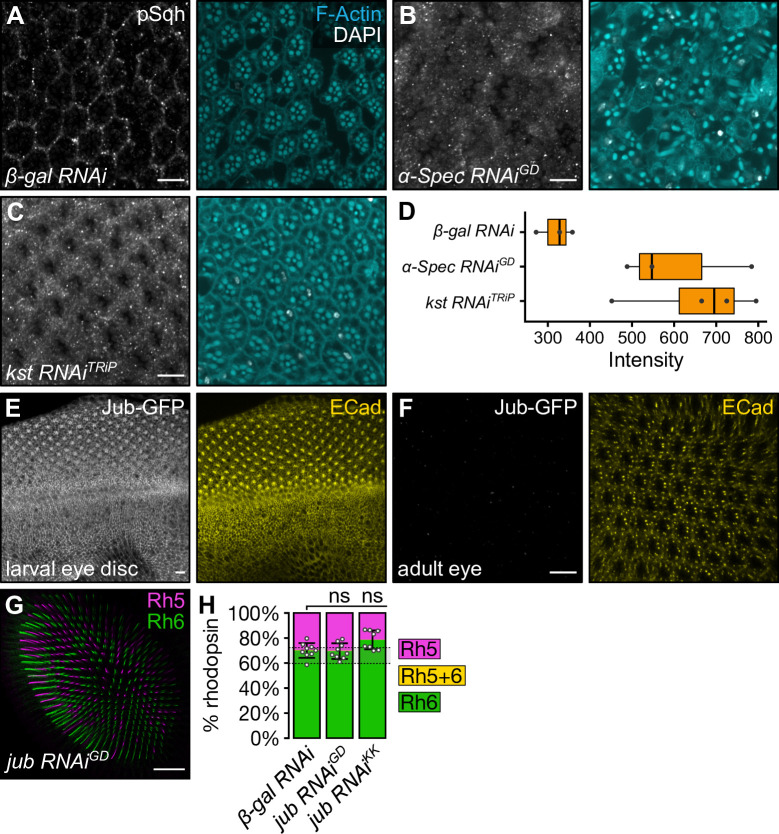
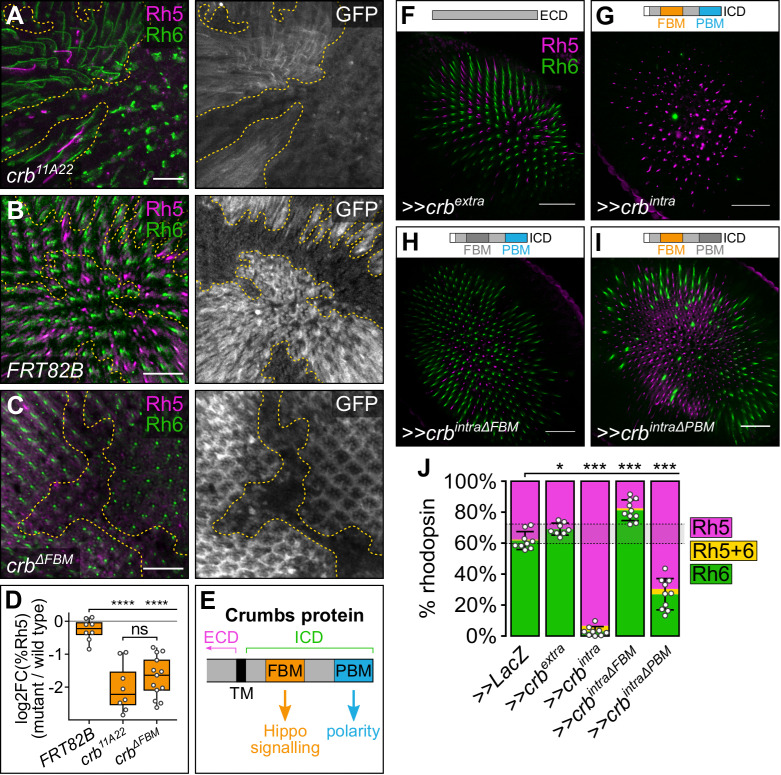
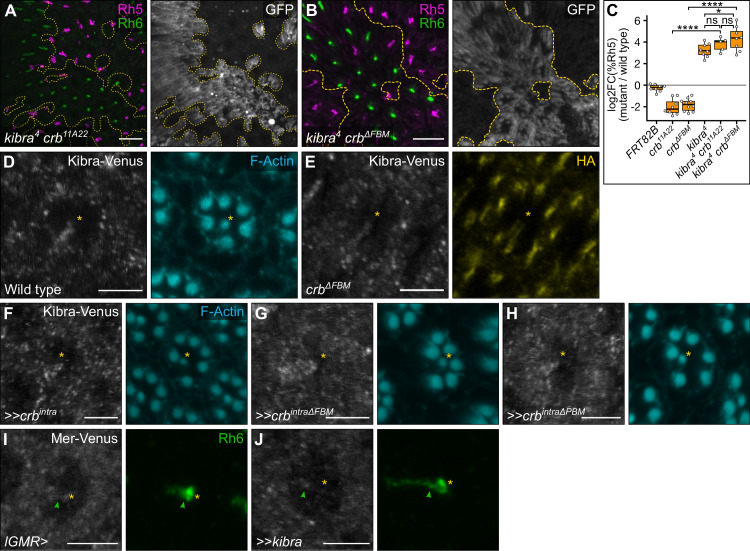
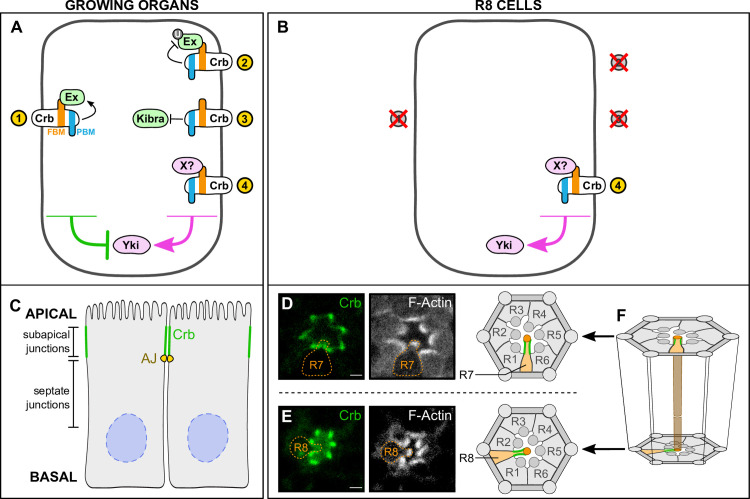
The Hippo pathway is an important regulator of organ growth and cell fate. In the R8 photoreceptor cells of the Drosophila melanogaster eye, the Hippo pathway controls the fate choice between one of two subtypes that express either the blue light-sensitive Rhodopsin 5 (Hippo inactive R8 subtype) or the green light-sensitive Rhodopsin 6 (Hippo active R8 subtype). The degree to which the mechanism of Hippo signal transduction and the proteins that mediate it are conserved in organ growth and R8 cell fate choice is currently unclear. Here, we identify Crumbs and the apical spectrin cytoskeleton as regulators of R8 cell fate. By contrast, other proteins that influence Hippo-dependent organ growth, such as the basolateral spectrin cytoskeleton and Ajuba, are dispensable for the R8 cell fate choice. Surprisingly, Crumbs promotes the Rhodopsin 5 cell fate, which is driven by Yorkie, rather than the Rhodopsin 6 cell fate, which is driven by Warts and the Hippo pathway, which contrasts with its impact on Hippo activity in organ growth. Furthermore, neither the apical spectrin cytoskeleton nor Crumbs appear to regulate the Hippo pathway through mechanisms that have been observed in growing organs. Together, these results show that only a subset of Hippo pathway proteins regulate the R8 binary cell fate decision and that aspects of Hippo signalling differ between growing organs and post-mitotic R8 cells.


Conflict of interest statement

The authors have declared that no competing interests exist.

Figures

Fig 1
Fig 1. Regulation of Drosophila melanogaster R8 cell fate by the Hippo pathway.
(A-A’) Schematic diagram of a D. melanogaster ommatidium. Yellow cells are R1-7 photoreceptor cells; orange cells are R8 photoreceptor cells; grey cells are other cells in the ommatidium. Blue circles are photoreceptor nuclei (nuc.); red lines/circles are rhabdomeres (rhab.). (A) Longitudinal section of an ommatidium. Note that R7 and R8 cells share the same optic path. The thick black line indicates approximately where the transverse section (A’) is drawn from. The distal section of the retina (towards the lens and outer surface of the eye) is to the top; the proximal section of the retina (towards the brain) is to the bottom. (A’) Transverse section of the proximal section of an ommatidium, showing the R8 cell. The anterior of the retina is to the left; the equator of the retina is to the bottom. (B) The main photoreceptor subtypes, showing R7 and R8 cell specification in each subtype. In the pale subtype, the R7 cell expresses Rh3 (blue), signalling to the R8 cell to take on a pR8 cell fate through a bistable loop composed of Warts (Wts), Melted (Melt) and Yorkie (Yki) and promoting expression of Rh5 (magenta). In the yellow subtype, the R7 cell expresses Spineless (Ss) which promotes Rh4 (orange), while the R8 cell expresses Rh6 (green). The subtypes are found in the specified proportions. (C-C’) Schematic of the Hippo pathway in epithelial tissue growth. Proteins labelled in green regulate R8 cell fate; proteins labelled in grey do not regulate R8 cell fate; proteins labelled in white have not been studied in R8 cell fate. The spectrin cytoskeleton is shown beneath the plasma membrane, highlighting the three spectrin proteins: α-Spec (yellow), β-Spec (cyan) and Kst (magenta). The yellow box (C’) highlights the core kinase cassette. Crb, Crumbs; Ex, Expanded; Hpo, Hippo; Jub, Ajuba; Mats, Mob as tumour suppressor; Mer, Merlin; Sav, Salvador; Sd, Scalloped; Sqh, Spaghetti squash; Wts, Warts; Yki, Yorkie. (D-F) Confocal microscope images of adult D. melanogaster retinas stained with anti-Rh5 (magenta) and anti-Rh6 (green) antibodies. The indicated RNAi lines were driven by lGMR-Gal4. Retinas expressing β-gal RNAi had a wild type ratio of R8 subtypes (D); retinas expressing yki RNAi had almost exclusively pR8 cells (E); retinas expressing wts RNAi had almost exclusively yR8 cells (F). Scale bars are 50μm.
Fig 2
Fig 2. The apical spectrin cytoskeleton promotes pR8 cell fate.
(A-C) Confocal microscope images of adult D. melanogaster retinas stained with anti-Rh5 (magenta) and anti-Rh6 (green) antibodies. The indicated RNAi lines were driven by lGMR-Gal4. Retinas expressed α-Spec RNAiGD (A), β-Spec RNAiTRiP (B) and kst RNAiTRiP (C). Scale bars are 50μm. (D) Proportion of R8 cells that express Rh5 (magenta), Rh6 (green), or both (yellow). The error bars represent the standard deviation of total % Rh5 (% cells expressing only Rh5 and cells co-expressing Rh5 and Rh6). Total % Rh5 was compared with two-sided, unpaired t-tests; ns = not significant, * = p<0.01, *** = p<0.0001. The shaded grey region between the dotted grey lines indicates the wild type Rh5:Rh6 ratio range. β-gal RNAi (Fig 1D): n = 9 retinas, 3976 ommatidia; α-spec RNAiGD: n = 8, 1466; α-spec RNAiTRiP (S1A Fig): n = 9, 2207; β-spec RNAiGD #42053 (S1B Fig): n = 8, 2882; β-spec RNAiGD #42054 (S1C Fig): n = 8, 2188; β-spec RNAiTRiP: n = 8, 2776; kst RNAiGD (S1D Fig): n = 9, 3689; kst RNAiTRiP: n = 9, 2361.
Fig 3
Fig 3. Subcellular localisation of α-Spectrin differs between late pupal and adult photoreceptor cells.
(A-B’) Confocal microscope images of late pupal (70 hours after pupariation formation, APF) and adult D. melanogaster retinas. Endogenously tagged Kst-Venus retinas were stained with an anti-GFP antibody to amplify the Venus signal, an anti-α-Spec antibody, DAPI (white; nuclei) and Rhodamine Phalloidin (cyan; F-actin in rhabdomeres and cell membranes). In each image, anterior is to the left. The dashed white boxes in A and B indicate the area shown in A’ and B’, respectively. White asterisks indicate the rhabdomere of the ommatidium; green arrowheads indicate the adherens junctions. Scale bars are 10μm in A and B; and 5μm in A’ and B’.
Fig 4
Fig 4. The apical spectrin cytoskeleton modulates phosphorylation of Spaghetti squash.
(A-C) Confocal microscope images of adult D. melanogaster eyes stained with anti-pSqh (grey) antibody, DAPI (white) and Phalloidin (F-actin, cyan). The indicated RNAi lines were driven by lGMR-Gal4. Retinas expressed β-gal RNAi (A), α-Spec RNAiGD (B), or kst RNAiTRiP (C). Scale bars are 10μm. (D) Boxplot showing intensity of pSqh in (A-C). (E-F) Confocal microscope images of a Jub-GFP D. melanogaster larval eye imaginal disc (E) and an adult eye (F). Tissues were stained with anti-GFP (grey) and anti-ECad (yellow) antibodies. Scale bars are 10μm. (G) Confocal microscope images of adult D. melanogaster retina stained with anti-Rh5 (magenta) and anti-Rh6 (green) antibodies. Expression of jub RNAiGD was driven by lGMR-Gal4. Scale bar is 20μm. (H) Proportion of R8 cells that express Rh5 (magenta), Rh6 (green), or both (yellow). The error bars represent the standard deviation of total % Rh5 (% cells expressing only Rh5 and cells co-expressing Rh5 and Rh6). Total % Rh5 was compared with a two-sided, unpaired t-test; ns = not significant. The shaded grey region between the dotted grey lines indicates wild type Rh5:Rh6 ratio range. β-gal RNAi (Fig 1D): n = 9 retinas, 3976 ommatidia; jub RNAiGD: n = 9, 3660; jub RNAiKK (S1E Fig): n = 8, 3048.
Fig 5
Fig 5. Crumbs regulates R8 cell fate through its FERM-binding motif.
(A-C) Confocal microscope images of adult D. melanogaster retinas stained with anti-GFP (grey), anti-Rh5 (magenta) and anti-Rh6 (green) antibodies. GFP-negative clones harboured the following alleles: crb11A22 (A), FRT82B (negative control) (B) or crbΔFBM.HA (C). Panel (A) is a maximum projection as rhodopsins localised to different focal planes in wild type and mutant clones. Scale bars are 20μm. (D) Log2 value of the ratio of total % Rh5 (% cells expressing only Rh5 and cells co-expressing Rh5 and Rh6) between mutant and wild type clones from the same tissue. Genotypes were compared with an ANOVA; ns = not significant; **** = p<0.0001. FRT82B: n = 8 retinas, 4065 ommatidia; crb11A22: n = 8, 1394; crbΔFBM.HA: n = 10, 3851. (E) Schematic illustration of the intracellular domain of the Crb protein. ECD, extracellular domain; ICD, intracellular domain; TM, transmembrane domain; FBM, FERM-binding motif; PBM, PDZ-binding motif. (F-I) Confocal microscope images of adult D. melanogaster retinas stained with anti-Rh5 (magenta) and anti-Rh6 (green) antibodies. The indicated transgenes were driven by lGMR-Gal4. Retinas expressed crbextra (F), crbintra (G), crbintraΔFBM (H) or crbintraΔPBM (I). Schematic illustrations above each retina indicate the transgenes expressed in each experiment; motifs in dark grey indicate mutated motifs in the transgene. Scale bars are 20μm. (J) Proportion of R8 cells that express Rh5 (magenta), Rh6 (green), or both (yellow). The error bars represent the standard deviation of total % Rh5 (% cells expressing only Rh5 and cells co-expressing Rh5 and Rh6). Total % Rh5 was compared with two-sided, unpaired t-tests; * = p<0.01, *** = p<0.0001. The shaded grey region between the dotted grey lines indicates wild type Rh5:Rh6 ratio range. >>LacZ: n = 9 retinas, 3211 ommatidia; >>crbextra: n = 8, 2153; >>crbintra: n = 9, 2381; >>crbintraΔFBM: n = 10, 3351; >>crbintraΔPBM: n = 10, 4041.
Fig 6
Fig 6. Crumbs does not affect the subcellular localisation of Kibra in R8 cells.
(A-B) Confocal microscope images of adult D. melanogaster retinas stained with anti-GFP (grey), anti-Rh5 (magenta) and anti-Rh6 (green) antibodies. GFP-negative clones possessed the following alleles: kibra4 crb11A22 (A), or kibra4 crbΔFBM (B). Panel (A) is a maximum projection as rhodopsins localised in different focal planes in wild type and mutant clones. Scale bars are 20μm. (C) Log2 value of the ratio of total % Rh5 (% cells expressing only Rh5 and cells co-expressing Rh5 and Rh6) between mutant and wild type clones from the same tissue. Genotypes were compared with an ANOVA; ns = not significant; *** = p<0.001. FRT82B (Fig 4B): n = 8 retinas, 4065 ommatidia; crb11A22 (Fig 4A): n = 8, 1394; crbΔFBM.HA (Fig 4C): n = 10, 3851; kibra4: n = 8, 2776; kibra4 crb11A22: n = 5, 1174; kibra4 crbΔFBM: n = 8, 2479. (D-E) Confocal microscope images of adult D. melanogaster retinas stained with anti-GFP (grey) antibody and either anti-HA antibody (yellow) or Phalloidin (F-actin, cyan). GFP-positive clones expressed kibra-Venus in wild-type cells (D) or cells harbouring the crbΔFBM.HA allele (E). Scale bars are 5μm. (F-H) Confocal microscope images of kibra-Venus adult Drosophila retinas stained with anti-GFP antibody (grey). The indicated transgenes were driven by lGMR-Gal4. Retinas expressed crbintra (F), crbintraΔFBM (G) or crbintraΔPBM (H). Scale bars are 5μm. (I-J) Confocal microscope images of Mer-Venus adult D. melanogaster retinas stained with anti-GFP (grey) and anti-Rh6 (green) antibodies. The indicated transgenes were driven by lGMR-Gal4. Retinas expressed no transgene (I) or kibra (J). Yellow stars indicate the R8 rhabdomere; green arrows indicate the stalk of the R8 cell. Scale bars are 5μm.
Fig 7
Fig 7. Model of Crumbs function in growing organs and R8 cells.
(A-B) Schematic diagram of the role of Crb in the Hippo pathway in growing organs (A) and R8 cells (B). Proteins and arrows in magenta promote organ growth or pR8 cell fate; proteins and arrows in green suppress organ growth or promote yR8 cell fate. Crb, Crumbs; Ex, Expanded; FBM, FERM-binding motif; PBM, PDZ-binding motif; Yki, Yorkie. (C-F) Subcellular ocalisation of Crb in epithelial cells and R8 photoreceptor cells. (C) Schematic diagram of epithelial cells, with Crb localisation (green) at the sub-apical regions. Adherens junctions (AJ) are depicted in yellow, nuclei in blue. (D-E) Confocal microscope images of a Crb-GFP pupal ommatidium stained with Phalloidin (F-Actin). R7 and R8 cells are outlined in orange. Scale bars are 2μm. (F) Schematic diagram of an ommatidium, showing R7 and R8 planes from (D) and (E). The brown tube at the centre of the diagram indicates the optic path shared by the rhabdomeres of the R7 and R8 cells. Crb is shown in green; R7 and R8 cells are shown in orange.

Similar articles

Cited by

References

    1. Fuss SH, Ray A. Mechanisms of odorant receptor gene choice in Drosophila and vertebrates. Mol Cell Neurosci. 2009;41:101–112. doi: 10.1016/j.mcn.2009.02.014 - DOI - PubMed
    1. Barish S, Volkan PC. Mechanisms of olfactory receptor neuron specification in Drosophila. WIREs Dev Biol. 2015;4:609–621. doi: 10.1002/wdev.197 - DOI - PMC - PubMed
    1. Viets K, Eldred KC, Johnston RJ Jr. Mechanisms of Photoreceptor Patterning in Vertebrates and Invertebrates. Trends Genet. 2016;32:638–659. doi: 10.1016/j.tig.2016.07.004 - DOI - PMC - PubMed
    1. Ready DF. Drosophila Compound Eye Morphogenesis: Blind Mechanical Engineers? Results and Problems in Cell Differentiation: Drosophila Eye Development. 2002. pp. 191–204. doi: 10.1007/978-3-540-45398-7_12 - DOI - PubMed
    1. Schnaitmann C, Garbers C, Wachtler T, Tanimoto H. Color discrimination with broadband photoreceptors. Curr Biol. 2013;23:2375–2382. doi: 10.1016/j.cub.2013.10.037 - DOI - PubMed

Publication types

MeSH terms

Grants and funding

K.F.H was supported by the National Health and Medical Research Council of Australia (1078220 and 1194467) (https://www.nhmrc.gov.au/). J.M.P. was supported by an Australian Postgraduate Award (https://scholarships.unimelb.edu.au/awards/graduate-research-scholarships). This research was supported by a grant to K.F.H. from the Australian Research Council (DP180102044) (https://www.arc.gov.au/). The funders had no role in study design, data collection and analysis, decision to publish, or preparation of the manuscript.

LinkOut - more resources