. 2021 May 8;11(14):6905-6921.
doi: 10.7150/thno.56882. eCollection 2021.

Site-specific glycoproteomic analysis revealing increased core-fucosylation on FOLR1 enhances folate uptake capacity of HCC cells to promote EMT

Affiliations

Site-specific glycoproteomic analysis revealing increased core-fucosylation on FOLR1 enhances folate uptake capacity of HCC cells to promote EMT

Li Jia et al. Theranostics. .

Abstract

Rationale: Epithelial-mesenchymal transition (EMT) has been recognized as an important step toward high invasion and metastasis of many cancers including hepatocellular carcinoma (HCC), while the mechanism for EMT promotion is still ambiguous. Methods: The dynamic alterations of site-specific glycosylation during HGF/TGF-β1-induced EMT process of three HCC cell lines were systematically investigated using precision glycoproteomic methods. The possible roles of EMT-related glycoproteins and site-specific glycans were further confirmed by various molecular biological approaches. Results: Using mass spectrometry-based glycoproteomic methods, we totally identified 2306 unique intact glycopeptides from SMMC-7721 and HepG2 cell lines, and found that core-fucosylated glycans were accounted for the largest proportion of complex N-glycans. Through quantification analysis of intact glycopeptides, we found that the majority of core-fucosylated intact glycopeptides from folate receptor α (FOLR1) were up-regulated in the three HGF-treated cell lines. Similarly, core-fucosylation of FOLR1 were up-regulated in SMMC-7721 and Hep3B cells with TGF-β1 treatment. Using molecular approaches, we further demonstrated that FUT8 was a driver for HGF/TGF-β1-induced EMT. The silencing of FUT8 reduced core-fucosylation and partially blocked the progress of HGF-induced EMT. Finally, we confirmed that the level of core-fucosylation on FOLR1 especially at the glycosite Asn-201 positively regulated the cellular uptake capacity of folates, and enhanced uptake of folates could promote the EMT of HCC cells. Conclusions: Based on the results, we proposed a potential pathway for HGF or TGF-β1-induced EMT of HCC cells: HGF or TGF-β1 treatment of HCC cells can increase the expression of glycosyltransferase FUT8 to up-regulate the core-fucosylation of N-glycans on glycoproteins including the FOLR1; core-fucosylation on FOLR1 can then enhance the folate uptake capacity to finally promote the EMT progress of HCC cells.

Keywords: FOLR1; core-fucosylation; epithelial-mesenchymal transition; glycoproteome; hepatocellular carcinoma.


Conflict of interest statement

Competing Interests: The authors have declared that no competing interest exists.

Figures

Figure 1
Figure 1
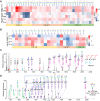
Epithelial-mesenchymal transition (EMT) of two hepatocellular carcinoma cell lines induced by HGF treatment. A. Workflow of dynamically site-specific glycosylation and global proteome analyses of two hepatocellular carcinoma cell lines during the EMT process. B. The down-regulation of E-cadherin and the up-regulation of N-cadherin were monitored at six time points of HGF treatment (0-72 h) by quantitative real-time PCR (qRT-PCR). Data are presented as mean±SEM of at least triplicates experiments. P values were determined by One-way ANOVA. n.s, no significant; *P < 0.05, **P < 0.01, ***P < 0.001, ****P < 0.0001. C. The EMT process could be classified into three stages based on changes of these two EMT markers. E: epithelial stage (0 h), I: intermediate stage (6 h-12 h), M: mesenchymal stage (24 h-72 h). D. Comparison of intact glycopeptides identified from SMMC-7721 and HepG2 cell lines. E. Distribution of glycan subtypes from intact glycopeptides identified from both cell lines.
Figure 2
Figure 2
Quantitative glycoproteomic analysis of two hepatocellular carcinoma cell lines during HGF-induced EMT. A. Distribution of intact glycopeptide alterations at the intermediate (I) and mesenchymal (M) stages of EMT in both cell lines. X axis: log2(I/E ratio) or log2(M/E ratio); Y axis: numbers of intact glycopeptides. B. Classification of quantified intact glycopeptides in both cell lines based on their attached glycan structures. The numbers indicate the unique glycopeptides modified by the corresponding glycans. C. Hierarchical clustering of altered intact glycopeptides (related to Table S4). The label at the right side: protein name-glycosylation site-glycan composition. For example, ITGA1-883-N2H9 means the protein ITGA1 is modified by the glycan N2H9 at the glycosylation site Asn-883. N: HexNAc; H: Hex; F: Fucose; S: Sialic acid. For example, the glycan “N2H9” indicates a high-mannose glycan that contains two HexNAc and nine Hexoses (also known as Man9).
Figure 3
Figure 3
Site-specific glycan profiling of highly core-fucosylated FOLR1. A. Heat map showing identified glycans at the glycosite Asn-69, Asn-161, Asn-201 of FOLR1 in three cell lines with HGF treatment. B. Heat map showing identified intact glycopeptides from FOLR1 in SMMC-7721 and Hep3B cells with TGF-β1 treatment. C, D. Representative MS/MS spectra for identification of an intact glycopeptide from FOLR1. C. Identification of the peptide sequence VS201N#YSR using a MS/MS spectrum with high energy HCD fragmentation. #indicates the glycosylation site. D. Determination of the glycan structure HexNAc4Hex5Fuc3 attached at the glycosite Asn-201 using a MS/MS spectrum with low energy HCD fragmentation. Core-fucosylation was identified by five feature Y ions (from peptide+HexNAc1Fuc1 ion at m/z=652.332+ to peptide+HexNAc2Hex3Fuc1 ion at m/z=996.952+). The outer arm fucosylation was determined based on the feature B ions (HexNAc1Hex1Fuc2, HexNAc1Hex1Fuc1, and HexNAc1Fuc1 but no HexNAc1Fuc2) as well as the related Y ions. The m/z values of Y ions with charge states 1+ and 2+ are labeled by light and dark purple, respectively.
Figure 4
Figure 4
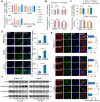
FUT8 promoted invasive ability of three HCC cell lines. A. The mRNA (upper) and protein (lower) levels of FUT8 in HGF-treated SMCC-7721 and HepG2 cell lines. B. The protein levels of FUT8, N-cadherin and E-cadherin in three stable cell lines with FUT8 overexpression. The grayscale values (lower) were measured from the western blotting data with Image J. C. The Matrigel Trans-well invasion assay (Scale bar = 10 µm) in stable HCC cell lines of FUT8 overexpression (FUT8 OE). D. The protein levels of FUT8, N-cadherin and E-cadherin in three pairs stable cell lines with FUT8 knockdown. E. The Matrigel Trans-well invasion assay (Scale bar = 50 µm) in stable HCC cell lines with FUT8 knockdown (shFUT8). In Matrigel Trans-well invasion assay, invading cells were measured by counting the numbers of cells that were invaded into the basal side of Matrigel-coated trans-well inserts after 24 h incubation (3 replicates per condition, 5 fields per replicate). F, G. Percentages of core-fucosylated glycopeptides among all identified glycopeptides based on their spectra counts in two stable HCC cell lines of FUT8 overexpression (F) and knockdown (G). H. The percentage of core-fucosylated glycans on FOLR1 in SMMC-7721 cells. Intact glycopeptide analyses were performed in triplicates for each condition. Data are presented as mean±SEM; P-values were determined by One-way ANOVA (A) or unpaired two-tailed t-test (C, E, and F-G). *P < 0.05, **P < 0.01, ***P < 0.001, ****P < 0.0001.
Figure 5
Figure 5
Core-fucosylation on FOLR1 increased uptake capacity of folate. A. The mRNA (upper) and protein (lower) levels of FOLR1 in SMMC-7721 and HepG2 cell lines treated by 10 ng/mL HGF for 72 h. B, C. The mRNA (upper) and protein (lower) levels of FOLR1 in two pairs stable cell lines of (B) FUT8 overexpression or (C) knockdown. The cell lines with FUT8 knockdown were further treated by HGF for 48 h before their FOLR1 mRNA measurement. D. Immunofluorescence staining of FUT8 over-expressed three cell lines treated with 300 µM FITC-FA for 24 h. Scale bar, 30 µm. Relative intensity of FITC-labeled green immunofluorescent was determined by ImageJ software (n=10). E. Immunofluorescence staining of siFUT8-mediated knockdown three cell lines treated with FITC-FA for 24 h. Scale bar, 50 µm. Relative intensity of red and green immunofluorescent was determined by Image-J software (n=10). F. Effects of various concentrations of folate (100~1200 µM) on the protein levels of FUT8, N-cadherin and E-cadherin in SMMC-7721 and HepG2 cells. All qPCR data were generated by averaging triplicate analyses per condition. GAPDH was used as a control. Data are presented as mean ± SEM. P values were determined by two-tailed unpaired t-test in (B-D), or One-way ANOVA was used in (E). n.s, no significance; *P < 0.05, **P < 0.01, ***P < 0.001, ****P < 0.0001.
Figure 6
Figure 6
Site-specific core fucosylation of FOLR1 is critical for folate uptake. A. qRT-PCR analysis of FOLR1 mRNA expression level in five stable cell lines of site-specific glycosite mutations of FOLR1. The stable cell lines of RFP and FOLR1 wild-type (WT) were used as negative and positive controls, respectively. The data were generated by averaging at least triplicate analyses per condition. GAPDH was used as a control. B. The protein expression of FOLR1 in SMMC-7721 (left) and HepG2 (right) cell lines with glycosite mutations on FOLR1. C, D. The protein expression levels of FUT8, N-cadherin and E-cadherin in FOLR1 mutated cell lines treated by HGF (10 ng/mL) for 24 h. The grayscale value was measured from the western blotting data with Image J. E-G. Immunofluorescence staining of FOLR1 mutated cell lines incubated with FITC-FA for 24 h. 5 fields per replicate, 3 replicates per condition. Scale bar, 30 µm. Relative intensity of red and green immunofluorescent was determined by ImageJ software (n=10). Data are presented as mean ± SEM. P values were determined by One-way ANOVA. n.s, no significance, *P < 0.05, **P < 0.01, ***P < 0.001, ****P < 0.0001.
Figure 7
Figure 7
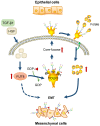
A proposed novel pathway for HGF-induced EMT of HCC cells. FUT8 is over-expressed in HGF or TGF-β1-treated HCC cells, which results in the up-regulation of core-fucosylation on FOLR1. The increased core-fucosylation on FOLR1 especially at the glycosite Asn-201 enhances the folate uptake capacity of the cell, providing sufficient dose of folates for promoting the EMT of HCC cells.

Similar articles

Cited by

References

    1. Bray F, Ferlay J, Soerjomataram I, Siegel RL, Torre LA, Jemal A. Global cancer statistics 2018: GLOBOCAN estimates of incidence and mortality worldwide for 36 cancers in 185 countries. CA Cancer J Clin. 2018;68:394–424. - PubMed
    1. Jemal A, Ward EM, Johnson CJ, Cronin KA, Ma J, Ryerson B. et al. Annual report to the nation on the status of cancer, 1975-2014, featuring survival. J Natl Cancer Inst. 2017;109:djx030. - PMC - PubMed
    1. Yang B, Li M, Tang W, Liu W, Zhang S, Chen L. et al. Dynamic network biomarker indicates pulmonary metastasis at the tipping point of hepatocellular carcinoma. Nat Commun. 2018;9:678. - PMC - PubMed
    1. Kudo M. Targeted and immune therapies for hepatocellular carcinoma: predictions for 2019 and beyond. World J Gastroenterol. 2019;25:789–807. - PMC - PubMed
    1. Giannelli G, Koudelkova P, Dituri F, Mikulits W. Role of epithelial to mesenchymal transition in hepatocellular carcinoma. J Hepatol. 2016;65:798–808. - PubMed

Publication types

MeSH terms