Characterizing Genetic Regulatory Elements in Ovine Tissues
- PMID: 34093640
- PMCID: PMC8173140
- DOI: 10.3389/fgene.2021.628849
Characterizing Genetic Regulatory Elements in Ovine Tissues
Abstract
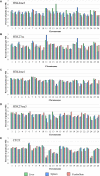
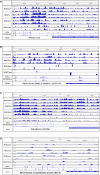
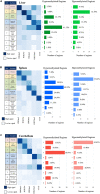
The Ovine Functional Annotation of Animal Genomes (FAANG) project, part of the broader livestock species FAANG initiative, aims to identify and characterize gene regulatory elements in domestic sheep. Regulatory element annotation is essential for identifying genetic variants that affect health and production traits in this important agricultural species, as greater than 90% of variants underlying genetic effects are estimated to lie outside of transcribed regions. Histone modifications that distinguish active or repressed chromatin states, CTCF binding, and DNA methylation were used to characterize regulatory elements in liver, spleen, and cerebellum tissues from four yearling sheep. Chromatin immunoprecipitation with sequencing (ChIP-seq) was performed for H3K4me3, H3K27ac, H3K4me1, H3K27me3, and CTCF. Nine chromatin states including active promoters, active enhancers, poised enhancers, repressed enhancers, and insulators were characterized in each tissue using ChromHMM. Whole-genome bisulfite sequencing (WGBS) was performed to determine the complement of whole-genome DNA methylation with the ChIP-seq data. Hypermethylated and hypomethylated regions were identified across tissues, and these locations were compared with chromatin states to better distinguish and validate regulatory elements in these tissues. Interestingly, chromatin states with the poised enhancer mark H3K4me1 in the spleen and cerebellum and CTCF in the liver displayed the greatest number of hypermethylated sites. Not surprisingly, active enhancers in the liver and spleen, and promoters in the cerebellum, displayed the greatest number of hypomethylated sites. Overall, chromatin states defined by histone marks and CTCF occupied approximately 22% of the genome in all three tissues. Furthermore, the liver and spleen displayed in common the greatest percent of active promoter (65%) and active enhancer (81%) states, and the liver and cerebellum displayed in common the greatest percent of poised enhancer (53%), repressed enhancer (68%), hypermethylated sites (75%), and hypomethylated sites (73%). In addition, both known and de novo CTCF-binding motifs were identified in all three tissues, with the highest number of unique motifs identified in the cerebellum. In summary, this study has identified the regulatory regions of genes in three tissues that play key roles in defining health and economically important traits and has set the precedent for the characterization of regulatory elements in ovine tissues using the Rambouillet reference genome.
Keywords: ChIP-seq; FAANG; WGBS; epigenetics; functional genomics; histone modifications; methylation; sheep.
Copyright © 2021 Davenport, Massa, Bhattarai, McKay, Mousel, Herndon, White, Cockett, Smith and Murdoch.
Conflict of interest statement
The authors declare that the research was conducted in the absence of any commercial or financial relationships that could be construed as a potential conflict of interest.
Figures


Similar articles
-
Genome-Wide Histone Modifications and CTCF Enrichment Predict Gene Expression in Sheep Macrophages.Front Genet. 2021 Jan 7;11:612031. doi: 10.3389/fgene.2020.612031. eCollection 2020. Front Genet. 2021. PMID: 33488675 Free PMC article.
-
Functionally Annotating Regulatory Elements in the Equine Genome Using Histone Mark ChIP-Seq.Genes (Basel). 2019 Dec 18;11(1):3. doi: 10.3390/genes11010003. Genes (Basel). 2019. PMID: 31861495 Free PMC article.
-
Putative Causal Variants Are Enriched in Annotated Functional Regions From Six Bovine Tissues.Front Genet. 2021 Jun 23;12:664379. doi: 10.3389/fgene.2021.664379. eCollection 2021. Front Genet. 2021. PMID: 34249087 Free PMC article.
-
Functional annotation of the animal genomes: An integrated annotation resource for the horse.PLoS Genet. 2023 Mar 2;19(3):e1010468. doi: 10.1371/journal.pgen.1010468. eCollection 2023 Mar. PLoS Genet. 2023. PMID: 36862752 Free PMC article. Review.
-
Enhancer/gene relationships: Need for more reliable genome-wide reference sets.Front Bioinform. 2023 Feb 24;3:1092853. doi: 10.3389/fbinf.2023.1092853. eCollection 2023. Front Bioinform. 2023. PMID: 36909938 Free PMC article. Review.
Cited by
-
Examining the extent of environmental contributions toward DNA methylation and phenotypic variation.Anim Front. 2021 Dec 17;11(6):83-89. doi: 10.1093/af/vfab056. eCollection 2021 Dec. Anim Front. 2021. PMID: 34934533 Free PMC article. No abstract available.
-
Epigenetic regulation of functional candidate genes for milk production traits in dairy sheep subjected to protein restriction in the prepubertal stage.BMC Genomics. 2023 Sep 1;24(1):511. doi: 10.1186/s12864-023-09611-y. BMC Genomics. 2023. PMID: 37658326 Free PMC article.
-
Diverse WGBS profiles of longissimus dorsi muscle in Hainan black goats and hybrid goats.BMC Genom Data. 2023 Dec 14;24(1):77. doi: 10.1186/s12863-023-01182-x. BMC Genom Data. 2023. PMID: 38097986 Free PMC article.
-
Butyrate Induces Modifications of the CTCF-Binding Landscape in Cattle Cells.Biomolecules. 2022 Aug 25;12(9):1177. doi: 10.3390/biom12091177. Biomolecules. 2022. PMID: 36139015 Free PMC article.
-
A high-density genome-wide association with absolute blood monocyte count in domestic sheep identifies novel loci.PLoS One. 2022 May 6;17(5):e0266748. doi: 10.1371/journal.pone.0266748. eCollection 2022. PLoS One. 2022. PMID: 35522671 Free PMC article.
References
LinkOut - more resources
Full Text Sources

