. 2021 Sep;30(9):1833-1853.
doi: 10.1002/pro.4136. Epub 2021 Jun 11.

Rheostat functional outcomes occur when substitutions are introduced at nonconserved positions that diverge with speciation

Affiliations

Rheostat functional outcomes occur when substitutions are introduced at nonconserved positions that diverge with speciation

Liskin Swint-Kruse et al. Protein Sci. 2021 Sep.

Abstract

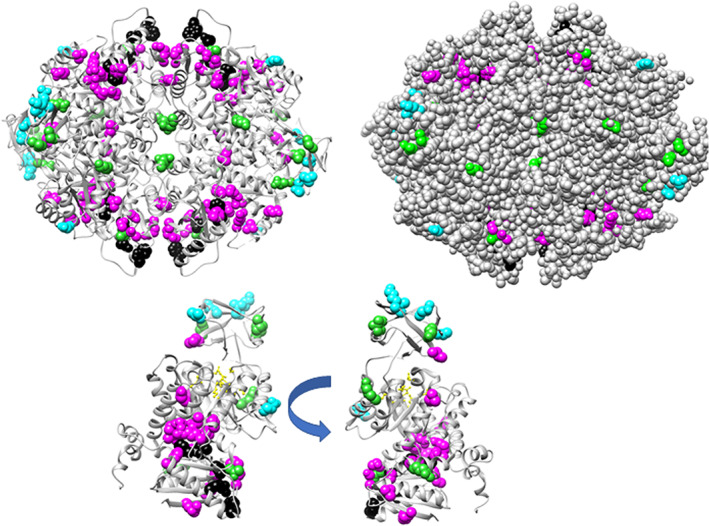
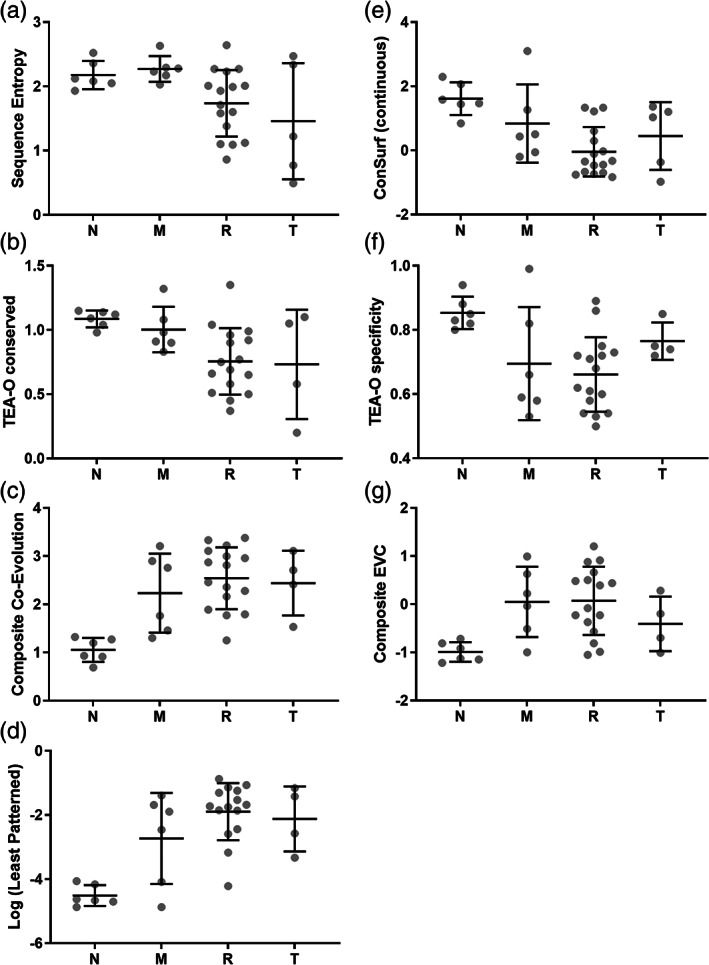
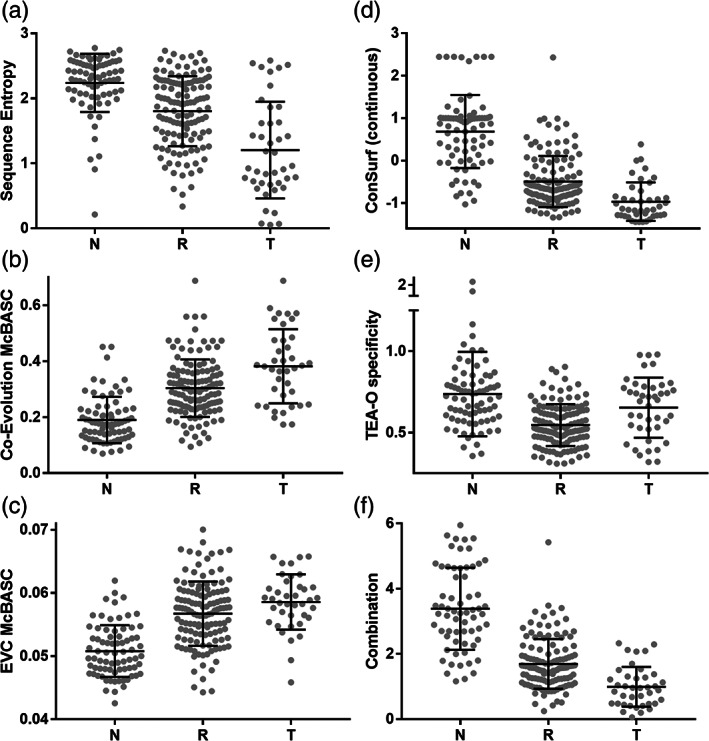
When amino acids vary during evolution, the outcome can be functionally neutral or biologically-important. We previously found that substituting a subset of nonconserved positions, "rheostat" positions, can have surprising effects on protein function. Since changes at rheostat positions can facilitate functional evolution or cause disease, more examples are needed to understand their unique biophysical characteristics. Here, we explored whether "phylogenetic" patterns of change in multiple sequence alignments (such as positions with subfamily specific conservation) predict the locations of functional rheostat positions. To that end, we experimentally tested eight phylogenetic positions in human liver pyruvate kinase (hLPYK), using 10-15 substitutions per position and biochemical assays that yielded five functional parameters. Five positions were strongly rheostatic and three were non-neutral. To test the corollary that positions with low phylogenetic scores were not rheostat positions, we combined these phylogenetic positions with previously-identified hLPYK rheostat, "toggle" (most substitution abolished function), and "neutral" (all substitutions were like wild-type) positions. Despite representing 428 variants, this set of 33 positions was poorly statistically powered. Thus, we turned to the in vivo phenotypic dataset for E. coli lactose repressor protein (LacI), which comprised 12-13 substitutions at 329 positions and could be used to identify rheostat, toggle, and neutral positions. Combined hLPYK and LacI results show that positions with strong phylogenetic patterns of change are more likely to exhibit rheostat substitution outcomes than neutral or toggle outcomes. Furthermore, phylogenetic patterns were more successful at identifying rheostat positions than were co-evolutionary or eigenvector centrality measures of evolutionary change.

Keywords: evolution; lactose repressor protein; phylogeny; pyruvate kinase; rheostat positions.


Figures

FIGURE 1
FIGURE 1
Locations of the phylogeny positions on the hLPYK structure (PDB: 4IMA 87). The top structure shows the homotetramer, for which three subunits have gray ribbons and one has a black ribbon. The lower structures show two views of the structure of a single monomer, with stars approximating the locations of the active (yellow), allosteric inhibitor (green), and allosteric activator (cyan) sites. Magenta spheres identify positions with strong phylogeny scores tested in this study: 107, 177, 192, 259, 107, 423, and 538
FIGURE 2
FIGURE 2
Functionality of hLPYK variants in response to allosteric effectors. At each indicated position, data are shown for all variants with measurable activity. For each pair of plots, activation in the presence of Fru‐1,6‐BP is shown on the left and inhibition in the presence of alanine is shown on the right. For all variants of one position, assays were conducted at the same time along with a wild‐type sample. The full set of wild‐type assays is shown in the top two panels to demonstrate reproducibility. Each value of K app‐PEP (y‐axis) was determined from samples with varied PEP concentrations; K app‐PEP corresponds to the concentration of PEP that yielded half‐maximal velocity. Varied concentrations of the allosteric activator and inhibitor, Fru‐1,6‐BP and Ala respectively (x‐axis) were used to determine values for K a‐PEP (y intercept). Error bars on each data point (some are smaller than actual data point) represent fit errors in K app‐PEP. See Figure S1 for more explanation of these plots and data fitting
FIGURE 3
FIGURE 3
RheoScale scores for hLPYK positions indicate their rheostatic (a), toggle (b), and neutral (c) substitution outcomes. The hLPYK positions from the current (“Phylogeny Study”) and prior studies, , are listed on the x‐axis. Positions in the prior “Neutral Study” were chosen by their having an absence of a detectable evolutionary pattern in the pYK sequence alignment. Positions in the prior “Allostery Study” were located in or near the two hLPYK allosteric binding sites. The RheoScale calculator was used to determine the overall effect a variant on the protein with respect to affinity to PEP (K a‐PEP), allosteric inhibition (K ix‐Ala), coupling of PEP and Ala (Q ax‐Ala), allosteric activation (K ix‐FBP), and coupling of the allosteric activator to PEP (Q ax‐FBP). Vertical dashed lines are to aid visual inspection of 5 symbols plotted for each position. Horizontal dashed lines represent the empirical significance thresholds determined for the three types of substitution outcomes, , ,
FIGURE 4
FIGURE 4
Composite neutral scores for hLPYK positions. The combined scores were calculated using all available values for the five functional parameters, as described in Section 4. A score of one means that, at the indicated position, all functional parameters for all variants were equivalent to wild‐type. A score of zero means that no functional parameter for any variant at that position was like wild‐type. The three hLPYK studies are denoted at the top of the plot, along with the average composite neutral score for that study. The “phylogeny” positions in this work were chosen by their high TEA‐O specificity scores. The “neutral” positions were chosen by their lack of change pattern in the sequence alignment. The “allostery” positions were chosen by their proximities to allosteric binding sites., , The composite neutral calculation shows that the functional parameters of the phylogeny positions were more susceptible to change than then those in the neutral study
FIGURE 5
FIGURE 5
Locations of the rheostat, toggle, neutral, and moderate positions on the hLPYK structure (PDB: 4IMA 87). The top left structure shows the homotetramer as a ribbon. The top right shows the structure in spacefilling to highlight the solvent exposed positions. The lower structures show two views of a single monomer. Positions with rheostat outcomes (magenta) comprised 55, 56, 75, 82, 107, 118, 192, 320, 423, 446, 449, 476, 481, 514, 531, and 538. Toggle substitution outcomes (black) were observed for positions 444, 501, 482, 483, and 494. Neutral substitution outcomes (cyan) were observed for positions 138,199, 206, 208, 214, and 246. Moderate substitution outcomes (lime green) were observed at positions 156, 177, 210, 412, 259, and 445. For structural reference the catalytic sites are shown in yellow (positions 85, 87, 89, 125, 126, 284, 308, and 340)
FIGURE 6
FIGURE 6
Various bioinformatic scores for four classes of hLPYK positions. The distributions of (a) sequence entropy, (b,e,f) phylogenetic, (c) co‐evolutionary, (d) least patterned, and (g) composite eigenvector centrality scores for hLPYK neutral (“N”), moderate (“M”), rheostat (“R”), and toggle (“T”) positions are shown. Black lines within each distribution represent the mean and standard deviation. For the TEA‐O specificity plot (f), the fact that many of these hLPYK positions were chosen via this parameter may bias the distribution. In (e), note that ConSurf calculations derive analog (continuous) scores for each position (shown here) and then discretize these scores into nine categories; we preferred the continuous score because it avoids the use of predetermined thresholds. p values from Kruskal–Wallis ANOVA, which tests the hypothesis that the four sets of scores are derived from the same distribution, are as follows: Sequence entropy, 0.631; ConSurf, 0.0048; TEA‐O conserved, 0.017; TEA‐O specificity, 0.0183; composite co‐evolution, 0.0032; composite EVC, 0.011; least patterned, 0.0015
FIGURE 7
FIGURE 7
Various bioinformatic scores for three classes of LacI positions. The distributions of (a) sequence entropies and representative (b) co‐evolutionary (c) eigenvector centrality, (d,e) phylogenetic and (f) combined scores for LacI neutral (“N”), rheostat (“R”), and toggle (“T”) positions. Black lines show the mean and standard deviation for each distribution of scores. The distributions from additional co‐evolutionary and eigenvector centrality algorithms are in Figure S6; statistical measures of these three groups are in Tables S4 and S5. In (d), note that ConSurf calculations derive analog (continuous) scores for each position (shown here) and then discretize these scores into nine categories for its final presentation (not shown); the distributions of both continuous and discrete scores for the LacI positions were examined in statistical analyses (Table 3). The distribution of discrete scores better identified neutral positions, whereas the distributions of continuous scores better separated toggle and rheostat positions. (f) Combination scores were calculated for each LacI position from the analyses listed in Section 4 (Equation (2))

Similar articles

Cited by

References

    1. Gray VE, Kukurba KR, Kumar S. Performance of computational tools in evaluating the functional impact of laboratory‐induced amino acid mutations. Bioinformatics. 2012;28:2093–2096. - PMC - PubMed
    1. Miller M, Bromberg Y, Swint‐Kruse L. Computational predictors fail to identify amino acid substitution effects at rheostat positions. Sci Rep. 2017;7:41329. - PMC - PubMed
    1. Fenton AW, Page BM, Spellman‐Kruse A, Hagenbuch B, Swint‐Kruse L. Rheostat positions: A new classification of protein positions relevant to pharmacogenomics. Med Chem Res. 2020;29:1133–1146. - PMC - PubMed
    1. Hodges AM, Fenton AW, Dougherty LL, Overholt AC, Swint‐Kruse L. RheoScale: A tool to aggregate and quantify experimentally determined substitution outcomes for multiple variants at individual protein positions. Hum Mutat. 2018;39:1814–1826. - PMC - PubMed
    1. Meinhardt S, Manley MW Jr, Parente DJ, Swint‐Kruse L. Rheostats and toggle switches for modulating protein function. PLoS One. 2013;8:e83502. - PMC - PubMed

Publication types

MeSH terms