Comparative Study
. 2021 May 19;10(5):1257.
doi: 10.3390/cells10051257.

Regional Differences in Heat Shock Protein 25 Expression in Brain and Spinal Cord Astrocytes of Wild-Type and SOD1 G93A Mice

Affiliations
Comparative Study

Regional Differences in Heat Shock Protein 25 Expression in Brain and Spinal Cord Astrocytes of Wild-Type and SOD1 G93A Mice

Rebecca San Gil et al. Cells. .

Abstract

Heterogeneity of glia in different CNS regions may contribute to the selective vulnerability of neuronal populations in neurodegenerative conditions such as amyotrophic lateral sclerosis (ALS). Here, we explored regional variations in the expression of heat shock protein 25 in glia under conditions of acute and chronic stress. Hsp27 (Hsp27; murine orthologue: Hsp25) fulfils a number of cytoprotective functions and may therefore be a possible therapeutic target in ALS. We identified a subpopulation of astrocytes in primary murine mixed glial cultures that expressed Hsp25. Under basal conditions, the proportion of Hsp25-positive astrocytes was twice as high in spinal cord cultures than in cortical cultures. To explore the physiological role of the elevated Hsp25 expression in spinal cord astrocytes, we exposed cortical and spinal cord glia to acute stress, using heat stress and pro-inflammatory stimuli. Surprisingly, we observed no stress-induced increase in Hsp25 expression in either cortical or spinal cord astrocytes. Similarly, exposure to endogenous stress, as modelled in glial cultures from SOD1 G93A-ALS mice, did not increase Hsp25 expression above that observed in astrocytes from wild-type mice. In vivo, Hsp25 expression was greater under conditions of chronic stress present in the spinal cord of SOD1 G93A mice than in wild-type mice, although this increase in expression is likely to be due to the extensive gliosis that occurs in this model. Together, these results show that there are differences in the expression of Hsp25 in astrocytes in different regions of the central nervous system, but Hsp25 expression is not upregulated under acute or chronic stress conditions.

Keywords: amyotrophic lateral sclerosis; astrocytes; glia; heat shock protein 27; heat shock response; motor neuron disease.


Conflict of interest statement

The authors declare no conflict of interest. The funders had no role in the design of the study; in the collection, analyses, or interpretation of data; in the writing of the manuscript, or in the decision to publish the results.

Figures

Figure 1
Figure 1
Hsp25 expression in LPS- or TNFα-stimulated primary cortical and spinal cord glial cultures. (a) Mixed primary cortical (Cx) and spinal cord (Sc) glia were treated with 80 µg/mL LPS or 100 ng/mL TNFα for 24 h. 30 µg of total protein was immunoblotted and probed for Hsp25 (25kDa) and α-tubulin (50 kDa). (b) Fold change in Hsp25 band intensity relative to the untreated cortical sample and normalised to α-tubulin to account for differences in protein loading. Data presented are the mean ± SEM from three biological replicates. Statistically significant differences between the means were assessed using a two-way ANOVA followed by Bonferroni’s post hoc test. (c) Representative images of untreated cortical and spinal cord glial cultures immunolabelled for GFAP (astrocytic marker; left) and Hsp25 (middle). Overlay (right) is shown with DAPI nuclear stain. Scale bar = 30 µm. (d) The proportion of Hsp25+ve astrocytes from cell counts of cortical and spinal cord glial cultures. Data shown are from one biological replicate and are the mean ± SEM of >300 cells across five wide field of view images. Statistically significant differences between the means were assessed using Student’s t-test, where p < 0.05 (*), p < 0.01 (**).
Figure 2
Figure 2
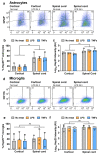
Flow cytometric analysis of Hsp25 expression in astrocytes and microglia after LPS and TNFα treatment. Primary cortical and spinal cord mixed glial cultures were treated with 80 µg/mL LPS or 100 ng/mL TNFα. The cells were fixed, permeabilised and immunolabelled for GFAP-Cy3, CD11b-APC/Cy7 and Hsp25-AF488. (a,d) Flow cytometric analysis of cortical and spinal cord glial cultures. Left–right: Representative cytograms of untreated and LPS treated cortical glial cultures, and untreated and LPS treated spinal cord cultures. Data are presented as pseudo-colour scatter plots where blue represents low and red represents a high frequency of cells. The percent of GFAP+ve or CD11b+ve cells in each gate is provided. (b,e) The percent of Hsp25+ve astrocytes or microglia as determined from the flow cytometric analysis. (c,f) The Hsp25-AF488 fluorescent median of the astrocytic or microglial population in arbitrary units (AU). Data shown are the means ± SEM of three biological replicates. Differences between the means were determined using a two-way ANOVA followed by Bonferroni’s post hoc test, where p < 0.01 (**).
Figure 3
Figure 3
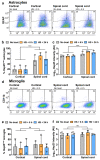
Flow cytometric analysis of Hsp25 expression in astrocytes and microglia after heat shock. Mixed primary cortical and spinal cord glia were heat shocked at 42 °C for 30 min and allowed to recover at 37 °C for 6 or 24 h. Cells were then fixed, permeabilised, immunolabelled for GFAP-Cy3, CD11b-APC/Cy7 and Hsp25-AF488 and analysed by flow cytometry. (a,d) Flow cytometric analysis of cortical and spinal cord glial cultures. Left–right: Representative cytograms of untreated and heat shocked cortical glial cultures, and untreated and heat shocked spinal cord cultures. Data are presented as pseudo-colour plots where blue represents low and red represents a high frequency of cells. Outlier events are shown as individual black dots. The percent of GFAP+ve or CD11b+ve cells in each gate is provided. (b,e) The percent of Hsp25+ve astrocytes or microglia as determined from the flow cytometric analysis. (c,f) The median of the Hsp25-AF488 fluorescence intensity of the astrocytic or microglial population. Data shown are the means ± SEM of three biological replicates. Potential differences between the means were assessed using a two-way ANOVA followed by Bonferroni’s post hoc test, where p < 0.001 (***).
Figure 4
Figure 4
Hsp25 expression in SOD1 G93A mixed glial cultures derived from the cortex and spinal cord. Mixed primary cortical and spinal cord glia were either treated with LPS (80 µg/mL) or heat shocked (42 °C/30 min followed by recovery at 37 °C/24 h). Cells were then harvested for immunoblotting or fixed, permeabilised and immunolabelled for GFAP and Hsp25 and analysed by fluorescence microscopy. (a,b) Immunoblotting, quantification and fold change of Hsp25 (25 kDa) levels in whole-cell lysates relative to β-actin in cortical and spinal cord samples. (c) Immunofluorescence of mixed glial cultures immunolabelled for Hsp25 and GFAP and counterstained with DAPI. Scale bar = 20 µm. (d) The average intensity of Hsp25-AF488 staining normalised to WT cortical control in cortical and spinal cord samples. Data shown are the means ± SEM of 2–3 independent experiments. Statistically significant differences between the means were assessed using a two-way ANOVA followed by Bonferroni’s post hoc test, where p < 0.0001 (****).
Figure 5
Figure 5
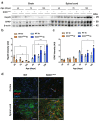
Hsp25 expression in the adult spinal cord and cortex of WT and SOD1 G93A mice. (a) Immunoblot analysis of Hsp25 and GFAP expression levels in whole brain and whole spinal cord lysates. (b) Quantification of Hsp25 and (c) GFAP expression in the brain and spinal cord of 40-, 75- and 105-day-old WT and SOD1 G93A mice. Data are displayed as the mean ± SEM of 2-3 biological replicates and analysed by two-way ANOVA with post hoc Tukey tests, where p < 0.05 (*) and p < 0.001 (***). (d) Immunofluorescence of layer V of the cortex and ventral horn spinal cord sections from 90 day old WT and SOD1 G93A mice. Scale bar: 20µm.

Similar articles

Cited by

References

    1. Allen N.J., Lyons D.A. Glia as architects of central nervous system formation and function. Science. 2018;362:181–185. doi: 10.1126/science.aat0473. - DOI - PMC - PubMed
    1. De Haas A.H., Boddeke H.W.G.M., Biber K. Region-specific expression of immunoregulatory proteins on microglia in the healthy CNS. Glia. 2008;56:888–894. doi: 10.1002/glia.20663. - DOI - PubMed
    1. Farmer W.T., Abrahamsson T., Chierzi S., Lui C., Zaelzer C., Jones E.V., Bally B.P., Chen G.G., Théroux J.-F., Peng J., et al. Neurons diversify astrocytes in the adult brain through sonic hedgehog signaling. Science. 2016;351:849–854. doi: 10.1126/science.aab3103. - DOI - PubMed
    1. Grabert K., Michoel T., Karavolos M.H., Clohisey S., Kenneth Baillie J., Stevens M.P., Freeman T.C., Summers K.M., McColl B.W. Microglial brain region—Dependent diversity and selective regional sensitivities to aging. Nat. Neurosci. 2016;19:504–516. doi: 10.1038/nn.4222. - DOI - PMC - PubMed
    1. Ben Haim L., Rowitch D.H. Functional diversity of astrocytes in neural circuit regulation. Nat. Rev. Neurosci. 2017;18:31–41. doi: 10.1038/nrn.2016.159. - DOI - PubMed

Publication types

MeSH terms

LinkOut - more resources