

Real-World Health Care Resource Utilization and Costs Among US Patients with Knee Osteoarthritis Compared with Controls
- PMID: 34054301
- PMCID: PMC8153072
- DOI: 10.2147/CEOR.S302289
Real-World Health Care Resource Utilization and Costs Among US Patients with Knee Osteoarthritis Compared with Controls
Abstract
Purpose: To determine the prevalence, healthcare resource utilization and costs (HCRU&C) of knee osteoarthritis (OA) patients versus controls.
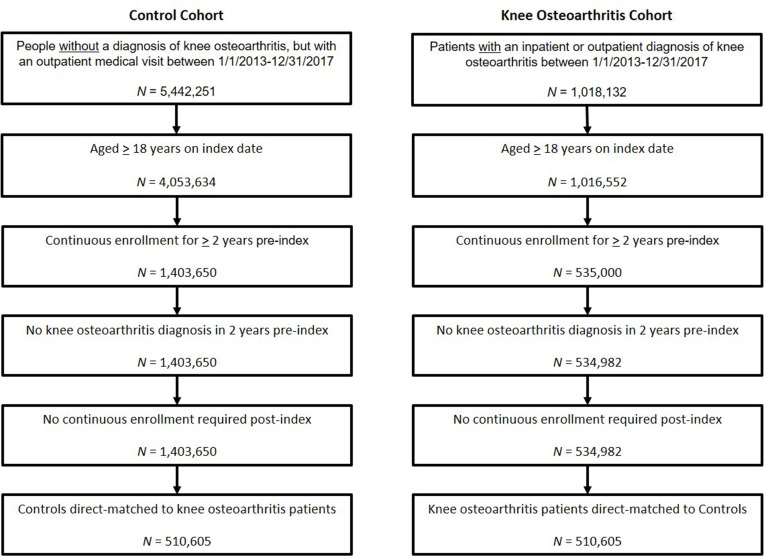
Patients and methods: Retrospective, matched-cohort administrative claims analysis using IBM MarketScan databases (2011-2017). Newly diagnosed, adult (18+ yrs) knee OA patients identified by ICD9/10 code were matched 1:1 to controls by age, sex, payer, and geography; alpha level set to 0.05. Prevalence was estimated for 2017. All-cause and knee OA-related HCRU&C reported per-patient-per-year (PPPY) over follow-up period up to 4 years.
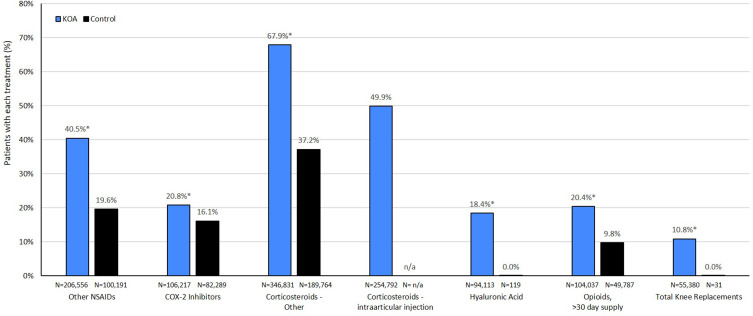
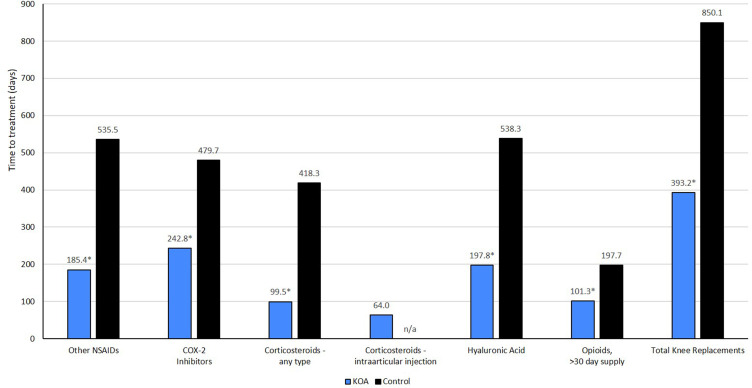
Results: Overall 2017 knee OA prevalence was 4% (615,514 knee OA/15.4M adults). A total of 510,605 patients meeting inclusion criteria were matched 1:1 with controls. The knee OA cohort had mean age 60 years and was 58% female. Versus controls, knee OA patients had significantly more PPPY outpatient (84.5 versus 45.0) and pharmacy (29.8 versus 19.8) claims, and significantly higher PPPY outpatient costs ($12,571 versus $6,465), and pharmacy costs ($3,655 versus $2,038). Knee OA patients incurred $7,707 more PPPY total healthcare costs than controls, of which $4,674 (60.6%) were knee OA-related medical claims and $1,926 (25%) were knee OA-related medications of interest. PPPY costs for nonselective NSAIDs, cyclooxygenase-2 (COX-2) inhibitors, intraarticular hyaluronic acid, non-acute opioids, and knee replacement were higher for knee OA patients than controls. Using median and mean all-cause total cost ($9,330 and $24,550, respectively), the estimated sum cost of knee OA patients in MarketScan ranged from $5.7B to $15B annually.
Conclusion: This retrospective analysis demonstrated an annual 2017 prevalence of 4.0% (≥18 years) and 13.2% (≥65 years) for newly diagnosed knee OA patients. Compared with controls, all-cause costs were significantly higher for knee OA patients, nearly double that of matched controls, attributable to increased medical and treatment costs and comorbidity treatment burden. Additionally, the estimated annual cost of knee OA treatment was substantial, ranging between $5.7 billion and $15 billion.
Keywords: administrative claims; arthritis; economic burden; pharmacy costs.
© 2021 Bedenbaugh et al.
Conflict of interest statement
AVB and JT are employees of Biosplice Therapeutics, Inc., and VL is an employee of The Kinetix Group. At the time of the study, MB and EHM were employees of IBM Watson Health. VL, MB, and EHM were contracted by Biosplice Therapeutics, Inc. to support the study.
Figures
Similar articles
-
Racial variation in healthcare resource utilization and expenditures in knee/hip osteoarthritis patients: a retrospective analysis of a Medicaid population.J Med Econ. 2023 Jan-Dec;26(1):1047-1056. doi: 10.1080/13696998.2023.2245298. J Med Econ. 2023. PMID: 37551123
-
Healthcare resource utilization and costs by age and joint location among osteoarthritis patients in a privately insured population.J Med Econ. 2017 Dec;20(12):1299-1306. doi: 10.1080/13696998.2017.1377717. Epub 2017 Sep 26. J Med Econ. 2017. PMID: 28880733
-
Health care resources and costs for treating peripheral artery disease in a managed care population: results from analysis of administrative claims data.J Manag Care Pharm. 2005 Nov-Dec;11(9):727-34. doi: 10.18553/jmcp.2005.11.9.727. J Manag Care Pharm. 2005. PMID: 16300416 Free PMC article.
-
Health Care Utilization and Direct Costs Among Patients Diagnosed with Cluster Headache in U.S. Health Care Claims Data.J Manag Care Spec Pharm. 2018 Sep;24(9):921-928. doi: 10.18553/jmcp.2018.24.9.921. J Manag Care Spec Pharm. 2018. PMID: 30156448 Free PMC article.
-
Economic Burden of Irritable Bowel Syndrome with Diarrhea: Retrospective Analysis of a U.S. Commercially Insured Population.J Manag Care Spec Pharm. 2017 Apr;23(4):453-460. doi: 10.18553/jmcp.2016.16138. Epub 2016 Nov 21. J Manag Care Spec Pharm. 2017. PMID: 28345443 Free PMC article.
Cited by
-
Health, Psychological and Demographic Predictors of Depression in People with Fibromyalgia and Osteoarthritis.Int J Environ Res Public Health. 2022 Mar 14;19(6):3413. doi: 10.3390/ijerph19063413. Int J Environ Res Public Health. 2022. PMID: 35329109 Free PMC article.
-
Glutamine metabolism modulates chondrocyte inflammatory response.Elife. 2022 Aug 2;11:e80725. doi: 10.7554/eLife.80725. Elife. 2022. PMID: 35916374 Free PMC article.
-
Effects of Terpenes on the Osteoarthritis Cytokine Profile by Modulation of IL-6: Double Face versus Dark Knight?Biology (Basel). 2023 Jul 28;12(8):1061. doi: 10.3390/biology12081061. Biology (Basel). 2023. PMID: 37626947 Free PMC article.
-
Consensus Guidelines on Interventional Therapies for Knee Pain (STEP Guidelines) from the American Society of Pain and Neuroscience.J Pain Res. 2022 Sep 8;15:2683-2745. doi: 10.2147/JPR.S370469. eCollection 2022. J Pain Res. 2022. PMID: 36132996 Free PMC article. Review.
-
Cooled radiofrequency ablation of the genicular nerves for chronic pain due to osteoarthritis of the knee: a cost-effectiveness analysis compared with intra-articular hyaluronan injections based on trial data.BMC Musculoskelet Disord. 2022 May 24;23(1):491. doi: 10.1186/s12891-022-05445-z. BMC Musculoskelet Disord. 2022. PMID: 35610642 Free PMC article. Clinical Trial.
References
-
- Hochberg MC, Cisternas MG. Osteoarthritis. In: The Burden of Musculoskeletal Diseases in the United States (BMUS). 4th ed. Rosemont, IL: United States Bone and Joint Initiative; 2019.
-
- Sinusas K. Osteoarthritis: diagnosis and treatment. Am Fam Physician. 2012;85(1):49–56. - PubMed
LinkOut - more resources
Full Text Sources
Other Literature Sources
Research Materials
