

Data-driven personalization of a physiologically based pharmacokinetic model for caffeine: A systematic assessment
- PMID: 34053199
- PMCID: PMC8302243
- DOI: 10.1002/psp4.12646
Data-driven personalization of a physiologically based pharmacokinetic model for caffeine: A systematic assessment
Abstract
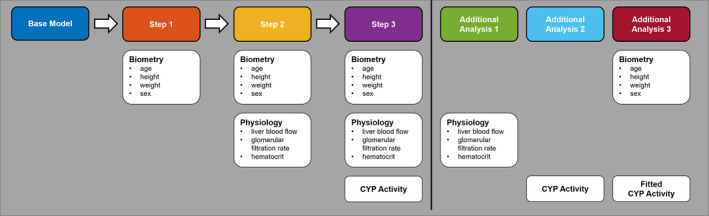
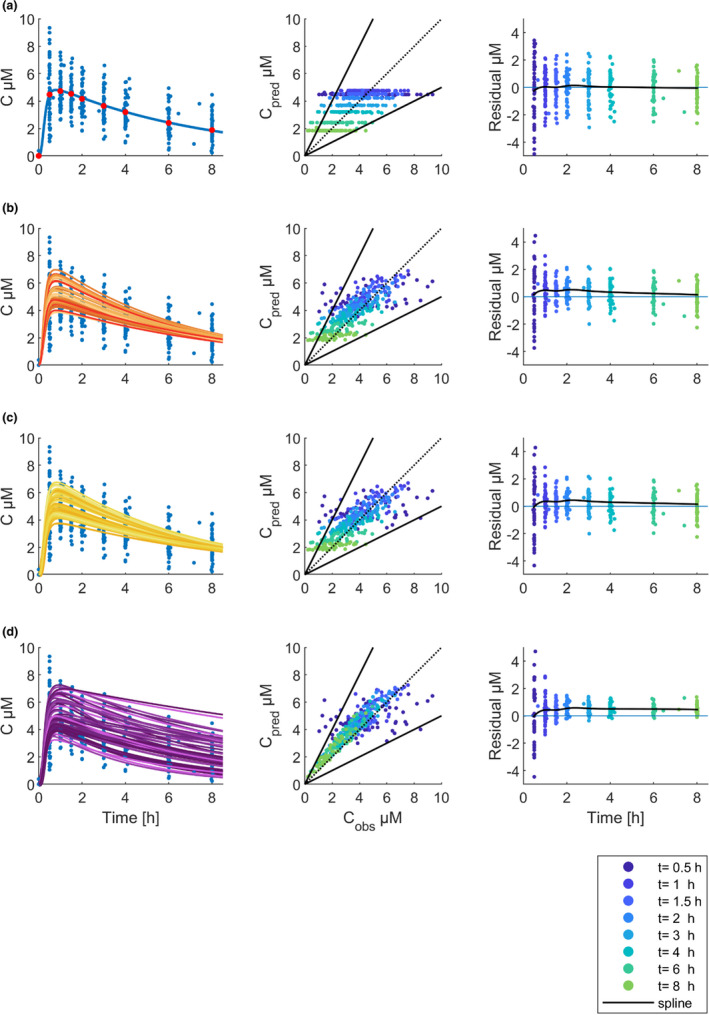
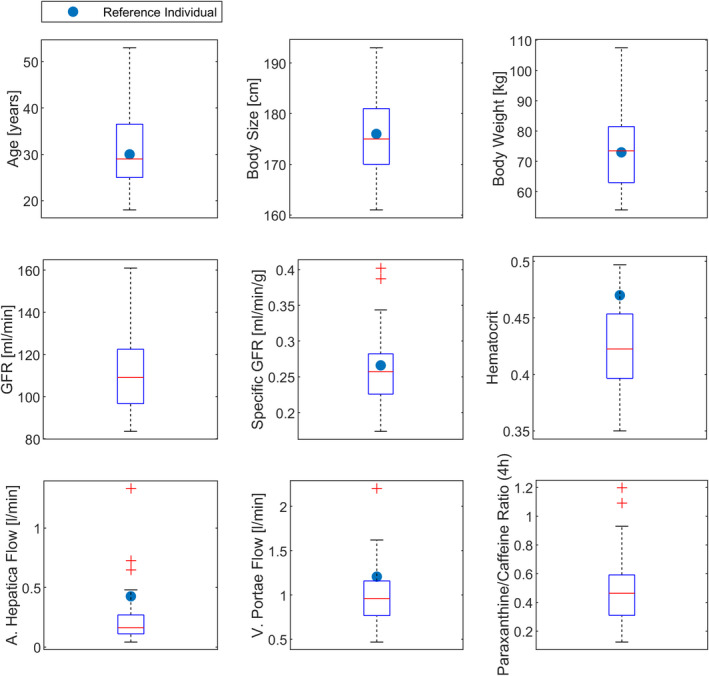
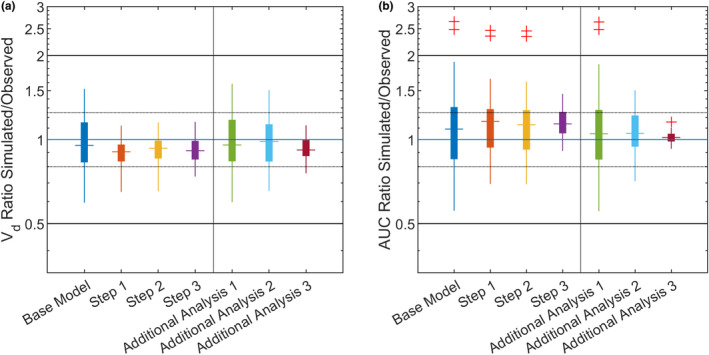
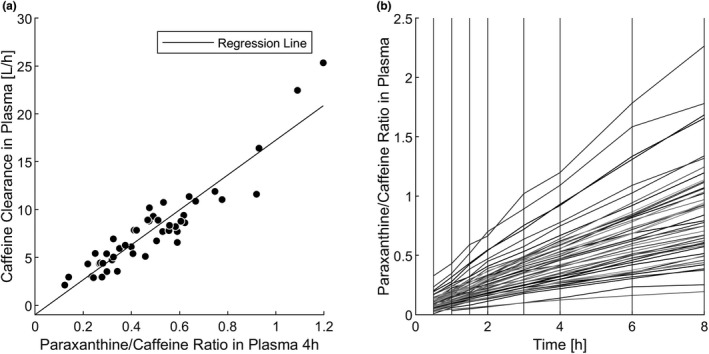
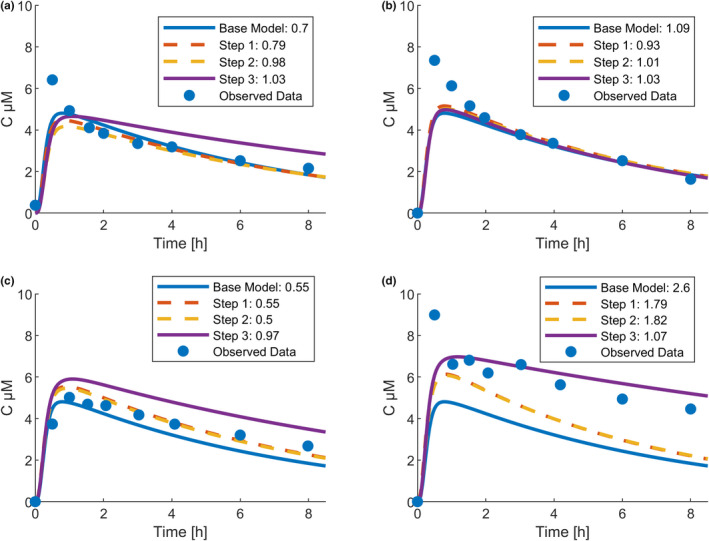
Physiologically based pharmacokinetic (PBPK) models have been proposed as a tool for more accurate individual pharmacokinetic (PK) predictions and model-informed precision dosing, but their application in clinical practice is still rare. This study systematically assesses the benefit of using individual patient information to improve PK predictions. A PBPK model of caffeine was stepwise personalized by using individual data on (1) demography, (2) physiology, and (3) cytochrome P450 (CYP) 1A2 phenotype of 48 healthy volunteers participating in a single-dose clinical study. Model performance was benchmarked against a caffeine base model simulated with parameters of an average individual. In the first step, virtual twins were generated based on the study subjects' demography (height, weight, age, sex), which implicated the rescaling of average organ volumes and blood flows. The accuracy of PK simulations improved compared with the base model. The percentage of predictions within 0.8-fold to 1.25-fold of the observed values increased from 45.8% (base model) to 57.8% (Step 1). However, setting physiological parameters (liver blood flow determined by magnetic resonance imaging, glomerular filtration rate, hematocrit) to measured values in the second step did not further improve the simulation result (59.1% in the 1.25-fold range). In the third step, virtual twins matching individual demography, physiology, and CYP1A2 activity considerably improved the simulation results. The percentage of data within the 1.25-fold range was 66.15%. This case study shows that individual PK profiles can be predicted more accurately by considering individual attributes and that personalized PBPK models could be a valuable tool for model-informed precision dosing approaches in the future.
© 2021 The Authors. CPT: Pharmacometrics & Systems Pharmacology published by Wiley Periodicals LLC on behalf of American Society for Clinical Pharmacology and Therapeutics.
Conflict of interest statement
R.F., A.R.P.S., J.F.S., J.L., R.B., and L.K. were employed by Bayer AG during the manuscript's preparation and are potential stockholders of Bayer AG. All other authors declared no competing interests for this work.
Figures
Similar articles
-
Impact of Ethnicity-Specific Hepatic Microsomal Scaling Factor, Liver Weight, and Cytochrome P450 (CYP) 1A2 Content on Physiologically Based Prediction of CYP1A2-Mediated Pharmacokinetics in Young and Elderly Chinese Adults.Clin Pharmacokinet. 2019 Jul;58(7):927-941. doi: 10.1007/s40262-019-00737-5. Clin Pharmacokinet. 2019. PMID: 30767128
-
Preterm Physiologically Based Pharmacokinetic Model. Part II: Applications of the Model to Predict Drug Pharmacokinetics in the Preterm Population.Clin Pharmacokinet. 2020 Apr;59(4):501-518. doi: 10.1007/s40262-019-00827-4. Clin Pharmacokinet. 2020. PMID: 31587145 Clinical Trial.
-
A pregnancy physiologically based pharmacokinetic (p-PBPK) model for disposition of drugs metabolized by CYP1A2, CYP2D6 and CYP3A4.Br J Clin Pharmacol. 2012 Nov;74(5):873-85. doi: 10.1111/j.1365-2125.2012.04363.x. Br J Clin Pharmacol. 2012. PMID: 22725721 Free PMC article.
-
Physiologically based pharmacokinetic (PBPK) modeling of caffeine and theophylline in neonates and adults: implications for assessing children's risks from environmental agents.J Toxicol Environ Health A. 2004 Feb 27;67(4):297-329. doi: 10.1080/15287390490273550. J Toxicol Environ Health A. 2004. PMID: 14713563 Review.
-
[On the possibility of patient phenotyping on the basis of cytochrome p-450 1A2 isoenzyme activity using caffeine as the test substrate].Eksp Klin Farmakol. 2009 Sep-Oct;72(5):61-5. Eksp Klin Farmakol. 2009. PMID: 19928580 Review. Russian.
Cited by
-
Virtual twins for model-informed precision dosing of clozapine in patients with treatment-resistant schizophrenia.CPT Pharmacometrics Syst Pharmacol. 2024 Mar;13(3):424-436. doi: 10.1002/psp4.13093. Epub 2024 Jan 19. CPT Pharmacometrics Syst Pharmacol. 2024. PMID: 38243630 Free PMC article.
-
Advancing Precision Medicine: A Review of Innovative In Silico Approaches for Drug Development, Clinical Pharmacology and Personalized Healthcare.Pharmaceutics. 2024 Feb 27;16(3):332. doi: 10.3390/pharmaceutics16030332. Pharmaceutics. 2024. PMID: 38543226 Free PMC article. Review.
-
Increased sinusoidal export of drug glucuronides is a compensative mechanism in liver cirrhosis of mice.Front Pharmacol. 2023 Nov 20;14:1279357. doi: 10.3389/fphar.2023.1279357. eCollection 2023. Front Pharmacol. 2023. PMID: 38053838 Free PMC article.
-
Computational Models for Clinical Applications in Personalized Medicine-Guidelines and Recommendations for Data Integration and Model Validation.J Pers Med. 2022 Jan 26;12(2):166. doi: 10.3390/jpm12020166. J Pers Med. 2022. PMID: 35207655 Free PMC article. Review.
-
Drug Distribution in Brain and Cerebrospinal Fluids in Relation to IC50 Values in Aging and Alzheimer's Disease, Using the Physiologically Based LeiCNS-PK3.0 Model.Pharm Res. 2022 Jul;39(7):1303-1319. doi: 10.1007/s11095-022-03281-3. Epub 2022 May 23. Pharm Res. 2022. PMID: 35606598 Free PMC article.
References
-
- Lesko LJ, Schmidt S. Individualization of drug therapy: history, present state, and opportunities for the future. Clin Pharmacol Therap. 2012;92(4):458‐466. - PubMed
-
- Schlender JF, Vozmediano V, Golden AG, et al. Current strategies to streamline pharmacotherapy for older adults. Eur J Pharmaceut Sci. 2018;111:432‐442. - PubMed
-
- Rowland M, Peck C, Tucker G. Physiologically‐based pharmacokinetics in drug development and regulatory science. Annu Rev Pharmacol Toxicol. 2011;51:45‐73. - PubMed
Publication types
MeSH terms
Substances
Grants and funding
LinkOut - more resources
Full Text Sources
Other Literature Sources
Medical
