. 2021 May 28;12(1):3243.
doi: 10.1038/s41467-021-23142-8.

Impact of DNA methylation on 3D genome structure

Affiliations

Impact of DNA methylation on 3D genome structure

Diana Buitrago et al. Nat Commun. .

Abstract

Determining the effect of DNA methylation on chromatin structure and function in higher organisms is challenging due to the extreme complexity of epigenetic regulation. We studied a simpler model system, budding yeast, that lacks DNA methylation machinery making it a perfect model system to study the intrinsic role of DNA methylation in chromatin structure and function. We expressed the murine DNA methyltransferases in Saccharomyces cerevisiae and analyzed the correlation between DNA methylation, nucleosome positioning, gene expression and 3D genome organization. Despite lacking the machinery for positioning and reading methylation marks, induced DNA methylation follows a conserved pattern with low methylation levels at the 5' end of the gene increasing gradually toward the 3' end, with concentration of methylated DNA in linkers and nucleosome free regions, and with actively expressed genes showing low and high levels of methylation at transcription start and terminating sites respectively, mimicking the patterns seen in mammals. We also see that DNA methylation increases chromatin condensation in peri-centromeric regions, decreases overall DNA flexibility, and favors the heterochromatin state. Taken together, these results demonstrate that methylation intrinsically modulates chromatin structure and function even in the absence of cellular machinery evolved to recognize and process the methylation signal.


Conflict of interest statement

The authors declare no competing interests.

Figures
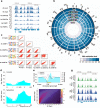
Fig. 1
Fig. 1. Methylation pattern across several samples and along the gene body.
a The pattern of methylation is conserved in all samples as illustrated for this 20 kb region of chromosome III (208,135..227,458) where the level of methylation at each position is represented for two samples with the four DNMTs expressed and four samples with each combination of 3 DNMTs. All the samples come from replicating cells, synchronized in G1. b Circular plot comparing DNA methylation for the samples in a and a control without methylation (None). Methylation levels decrease when one DNMT is missing, the strongest effect being without DNMT1 and the mildest effect when DNMT3b is not present. c Correlation between the sequence effect on methylation status among samples with different combinations of three DNMTs. Motif effects are estimated from logistic regression (for details see Methods) and correlation plots are produced for each pair of samples. Motifs have nearly the same effect in the two replicates with all DNMTs induced (correlation coefficient is cor = 0.999) and when DNMT1 (cor = 0.996) or DNMT3L (cor = 0.954) are removed. In contrast, the estimated effect of some motifs on methylation probability is different in samples lacking DNMT3a (cor = 0.793) or DNMT3b (cor = 0.631). The left panels show the sequence logo of the motifs preferentially methylated in each sample. d, f, g Comparison of methylation pattern in samples in exponential phase and at saturation. d Average methylation level around TSS and TTS (850 bp upstream and downstream from each point). e Superposition of the pattern of DNA methylation and the pattern of H3K4 methylation along the average gene body (from 3 kb upstream TSS to 3 kb downstream TTS). DNA methylation preferentially occurs where H3K4 is not methylated. f Heatmap showing the correlation between methylation probabilities in samples in G1 and at saturation. g The pattern of methylation is conserved in samples in G1 and samples at saturation as illustrated for this 20 Kb region of chromosome III (208,135..227,458) where the level of methylation at each position is represented for 2 replicas of each condition, G1 (in green) and saturation (in blue).
Fig. 2
Fig. 2. Correlation between DNA methylation and nucleosome coverage genome wide.
a Nucleosome positioning (in red) in a sample before (dashed lane) and after (plain lane) induction of methylation and average methylation probabilities (in blue). Plots are built around TSS and TTS (850 bp upstream and downstream from each point). Average nucleosome positioning does not change drastically upon methylation. b Percentage of CpG with methylation probability above 0.01 around well-positioned (W) nucleosomes. Nucleosome calls were considered well-positioned when nucleR peak width score and height score were higher than 0.6 and 0.4, respectively. DNA methylation is anti-correlated with nucleosome occupancy in W nucleosomes. Average methylation probability around nucleosome call center (150 bp upstream and downstream) for (c) Well positioned and (d) Fuzzy nucleosomes. e Average methylation probability per strand around nucleosome call center (75 bp upstream and downstream) of well-positioned nucleosomes.
Fig. 3
Fig. 3. Modeled nucleosome fibers from MNase-seq data.
a Modeled nucleosome fiber for (top panel) control and (lower panel) methylated cells. DNA base pairs are depicted as orange lines and nucleosomes as blue spheres (+1 and −1 nucleosomes are depicted in purple and green, respectively). Methylated regions (signal above 10% coverage) are highlighted as black balls. Experimental (b) and modeled (c) nucleosome position coverage for DUG2 gene (chromosome II). The TSS is highlighted in green and nucleosomes −1 and +1 are indicated. The blue sticks in the bottom correspond to methylated regions with their height proportional to methylation extent.
Fig. 4
Fig. 4. Nucleosome dynamics upon methylation at promoters.
a NucDyn score around highly methylated (in red) and lowly methylated CpGs (in black) at promoters. b Nucleosome coverage around +1 nucleosome for genes with highest (top 10%, plain red lane), lowest (bottom 10%, dotted red lane) or medium (45–55%, doted black lane) level of CpG methylation around promoters. c Nucleosome architecture around promoters according to their methylation level.
Fig. 5
Fig. 5. Correlation of DNA methylation, nucleosome positioning and gene expression.
a Methylation probability (shaded area) and nucleosome coverage (solid lines) around genes with expression in the top 10% (blue) or bottom 10% (red) expression level. b Log2 of the fold change in expression for genes with highly and lowly methylated promoters. c Gene expression difference between methylated and not methylated samples. RNA level difference is plotted on the x-axis and the Adj. p value on the y-axis. Downregulated (20 genes) and upregulated (63 genes) genes are shown in red and green, respectively. The genes with the highest changes are highlighted. d Promoter motif enrichment for genes with highly methylated promoters and increase in expression level using HOMER which uses a cumulative hypergeometric distribution to score motif enrichment in the target set compared to the background set. The p-value is not corrected for multiple testing.
Fig. 6
Fig. 6. Effect of DNA methylation on 3D genome structure.
Differential contact frequencies in control and methylation-induced samples in replica 1 for (a) whole genome and (b) four chromosomes. Blue indicates interactions with a higher frequency in the non-methylated control samples compared to the methylated samples, while red indicates the converse. c Comparison of contact frequencies between control and methylated Hi-C samples in cis (±50 Kb from the centromere, top panel) and in trans (lower panel). Contact frequencies for n = 16 chromosomes on two biological replicas for each of the two conditions. Boxplot lower and upper hinges correspond to the first and third quartiles, respectively, and the middle line represents the median. The upper and lower whiskers extend from the hinge to the largest and smallest values, respectively, but no further than 1.5 × IQR (Inter-quartile range) from the hinge. Notches extend to ±1.58 IQR/sqrt(n) and give a rough 95% confidence interval for the median. Circos plots displaying the significant (FDR < 0.5) differential interactions identified with diffHiC: d gained interactions (log2FC > 1) are clustered around the centromeres (red tick marks) and e lost interactions (log2FC < −1) preferentially occur between chromosomes. Structural changes measured on the ensemble of structures obtained with our restraint-based 3D model for each chromosome: f Mean radius of gyration computed around centromeres (±100 kb) and g flexibility of each chromosome measured by the RMSD of bead positions for the control (black) and methylated (red) samples. Values ± standard error are plotted (N = 260 and 482 ensemble structures for control and methylated samples, respectively). h Relative distance (distance divided by mean) between all telomeres in the ensemble of 3D structures (n = 496,000 distances). Outliers were not plotted (min/median/max values are 0.081/0.920/1.901 for control and 0.099/1.080/1.919 for methylated conditions). The p value is from a two-sided t-test for the difference in means. i Whole-genome 3D model for a representative structure from the ensemble for the control (Left) and methylated sample (Right). All chromosomes are represented as gray tubes, and the telomeres represented as colored spheres with a different color for each chromosome.
Fig. 7
Fig. 7. Chromosome conformation changes under DNA methylation.
a Circos diagrams of significant interactions in chromosome III for the control (left) and methylated (right) samples. Heatmaps displaying the log2 ratio (Methylated/Control) of (b) the contact frequencies and (c) the distances in the ensemble for chromosome III. Blue indicates interaction with a higher frequency or shorter distance in the non-methylated control sample and red indicates interactions with a higher frequency or shorter distance in the methylated samples. d 3D representative structures for chromosome III highlighting the distance between MAT and HML loci shown in green. The centromere is represented as a blue sphere. e Average distances (±standard error) between mating type loci in the ensemble of structures for chromosome III (n = 260 and 482 structures for control and methylated samples, respectively). f Circos diagrams of significant interactions in chromosome XII for the control (left) and methylated (right) samples. Log2 ratio (Methylated/Control) of (g) the contact frequencies and (h) the distances in the ensemble for chromosome XII.
Fig. 8
Fig. 8. Whole-genome 3D model.
Three views are provided representing three different angles for (ac) the control samples and (df) the methylated sample. Each chromosome is represented in a specific color. Centromeres are represented in yellow. The rDNA in chromosome XII is not represented due to the lack of information provided by the Hi-C in repeated regions.

Similar articles

Cited by

References

    1. Bird AP, Wolffe AP. Methylation-induced repression–belts, braces, and chromatin. Cell. 1999;99:451–454. doi: 10.1016/S0092-8674(00)81532-9. - DOI - PubMed
    1. Heyn H, Esteller M. DNA methylation profiling in the clinic: applications and challenges. Nat. Rev. Genet. 2012;13:679–692. doi: 10.1038/nrg3270. - DOI - PubMed
    1. Holz-Schietinger C, Matje DM, Reich NO. Mutations in DNA methyltransferase (DNMT3A) observed in acute myeloid leukemia patients disrupt processive methylation. J. Biol. Chem. 2012;287:30941–30951. doi: 10.1074/jbc.M112.366625. - DOI - PMC - PubMed
    1. Winkelmann J, et al. Mutations in DNMT1 cause autosomal dominant cerebellar ataxia, deafness and narcolepsy. Hum. Mol. Genet. 2012;21:2205–2210. doi: 10.1093/hmg/dds035. - DOI - PMC - PubMed
    1. Smith ZD, Meissner A. DNA methylation: roles in mammalian development. Nat. Rev. Genet. 2013;14:204–220. doi: 10.1038/nrg3354. - DOI - PubMed

Publication types

MeSH terms

LinkOut - more resources