. 2021 Aug 15;81(16):4305-4318.
doi: 10.1158/0008-5472.CAN-20-3929. Epub 2021 May 28.

Apolipoprotein E Promotes Immune Suppression in Pancreatic Cancer through NF-κB-Mediated Production of CXCL1

Affiliations

Apolipoprotein E Promotes Immune Suppression in Pancreatic Cancer through NF-κB-Mediated Production of CXCL1

Samantha B Kemp et al. Cancer Res. .

Abstract

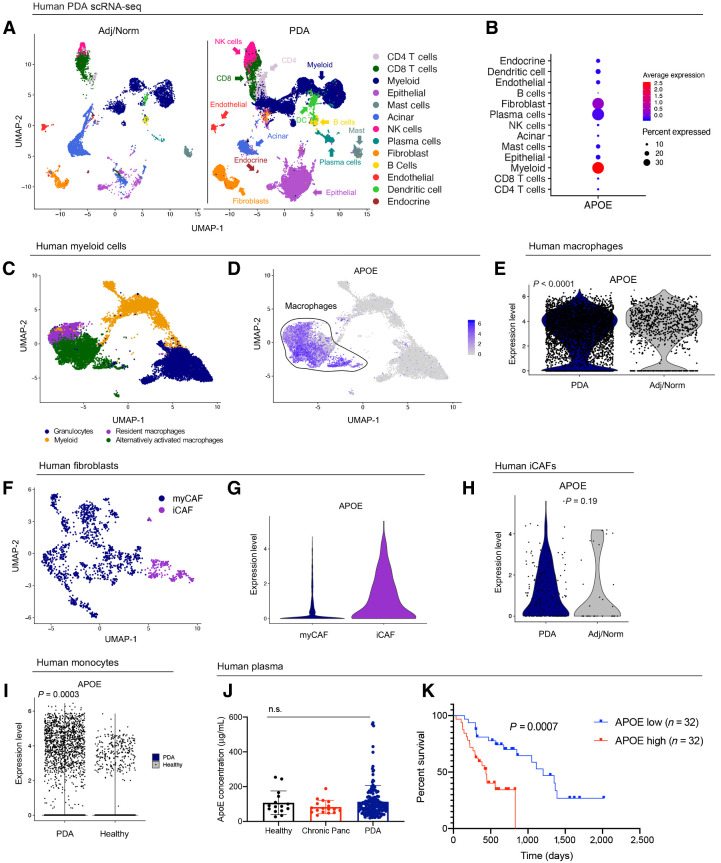
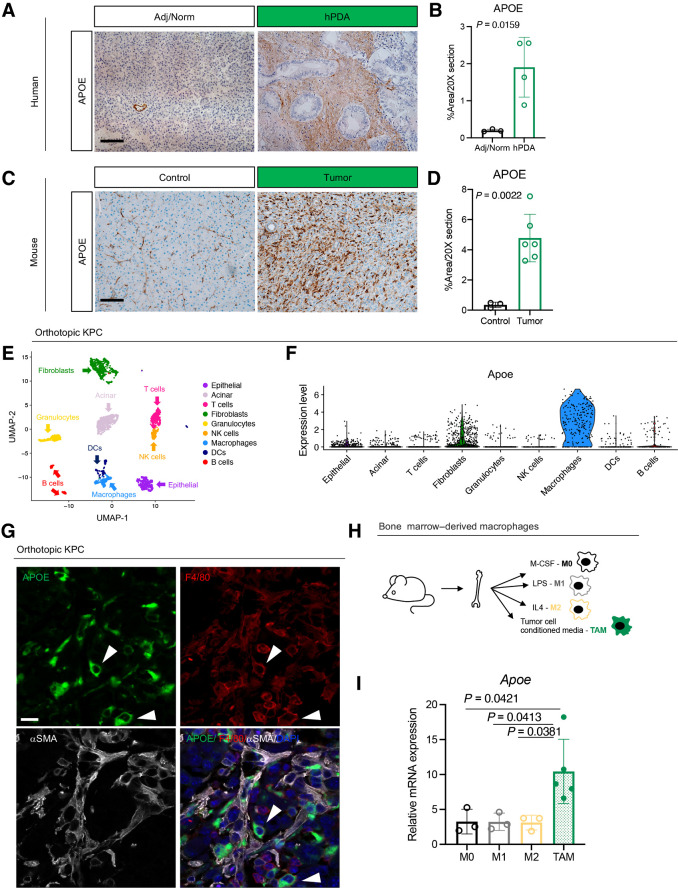
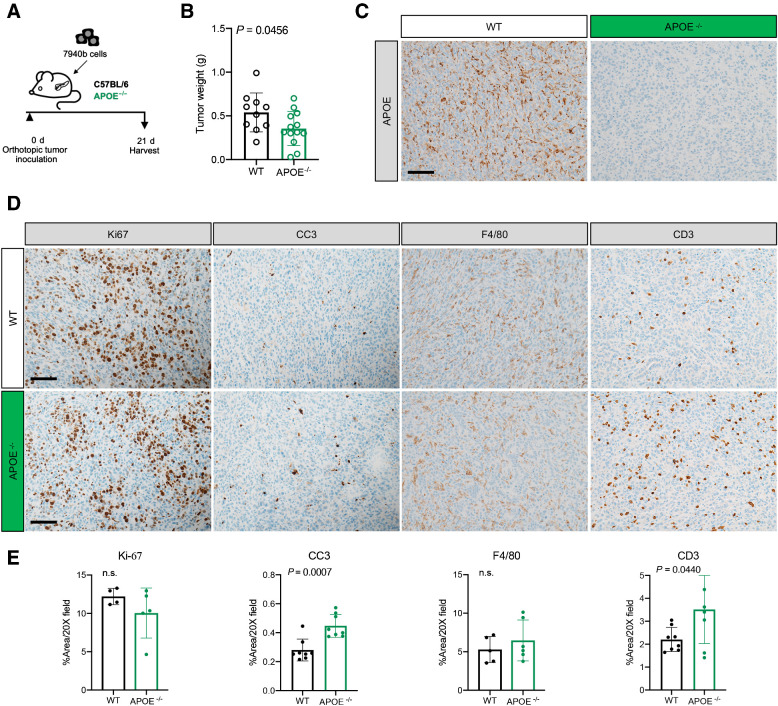
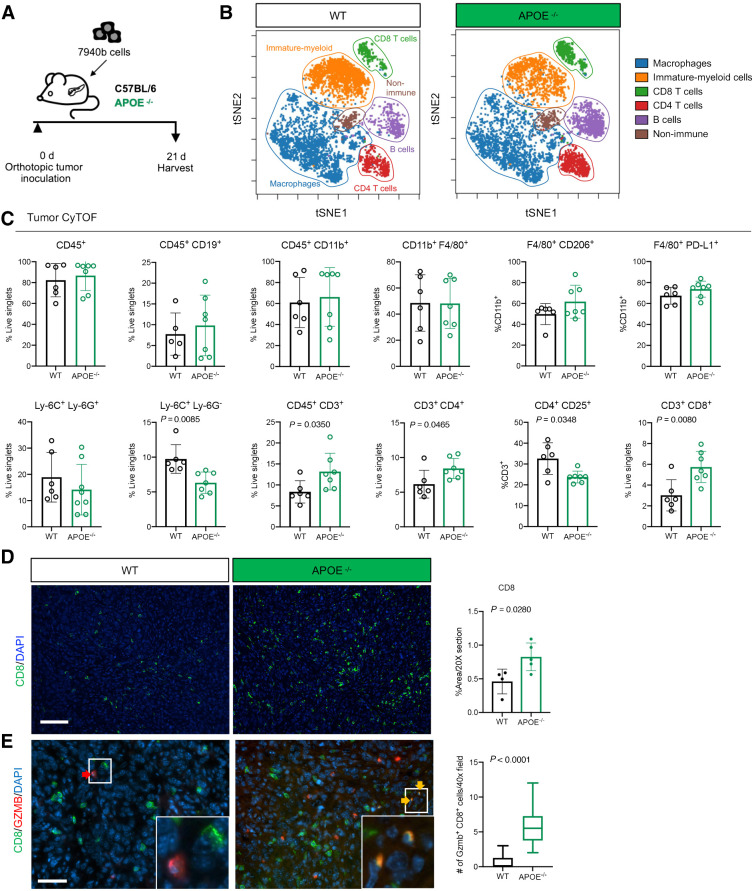
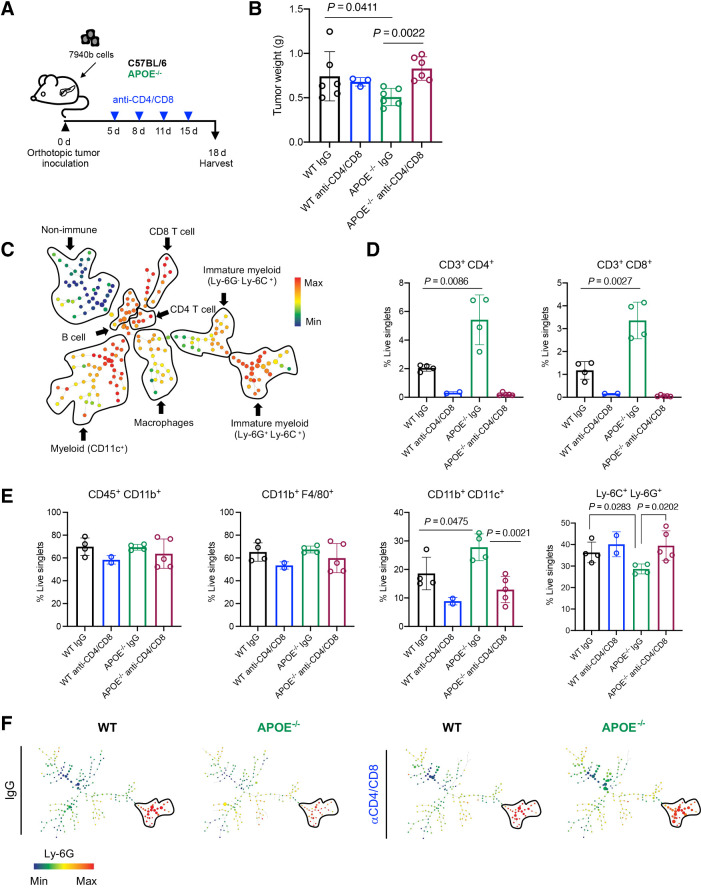
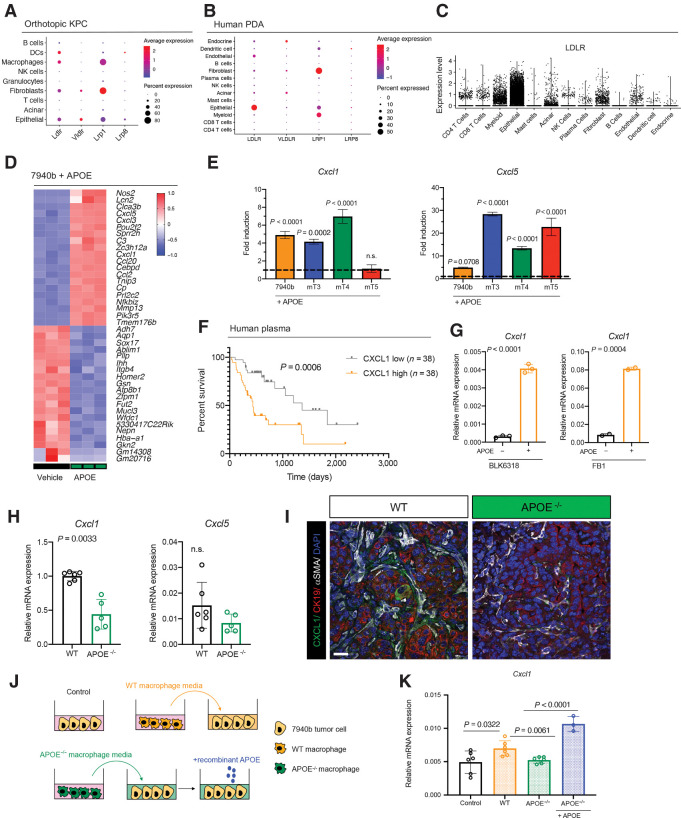
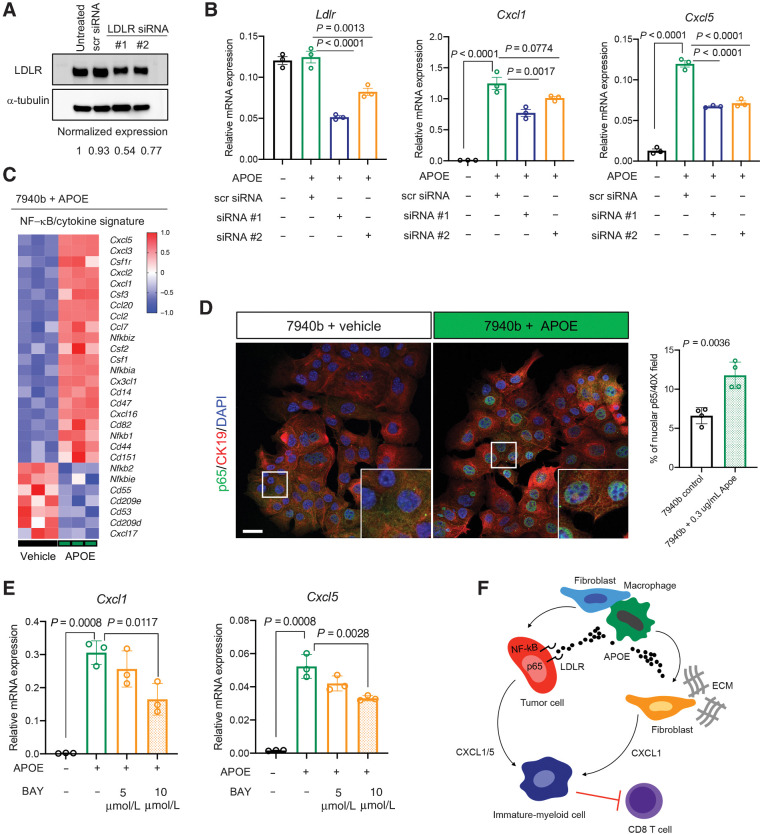
Pancreatic ductal adenocarcinoma (PDAC) is a lethal malignancy with few effective therapeutic options. PDAC is characterized by an extensive fibroinflammatory stroma that includes abundant infiltrating immune cells. Tumor-associated macrophages (TAM) are prevalent within the stroma and are key drivers of immunosuppression. TAMs in human and murine PDAC are characterized by elevated expression of apolipoprotein E (ApoE), an apolipoprotein that mediates cholesterol metabolism and has known roles in cardiovascular and Alzheimer's disease but no known role in PDAC. We report here that ApoE is also elevated in peripheral blood monocytes in PDAC patients, and plasma ApoE protein levels stratify patient survival. Orthotopic implantation of mouse PDAC cells into syngeneic wild-type or in ApoE-/- mice showed reduced tumor growth in ApoE-/- mice. Histologic and mass cytometric (CyTOF) analysis of these tumors showed an increase in CD8+ T cells in tumors in ApoE-/- mice. Mechanistically, ApoE induced pancreatic tumor cell expression of Cxcl1 and Cxcl5, known immunosuppressive factors, through LDL receptor and NF-κB signaling. Taken together, this study reveals a novel immunosuppressive role of ApoE in the PDAC microenvironment. SIGNIFICANCE: This study shows that elevated apolipoprotein E in PDAC mediates immune suppression and high serum apolipoprotein E levels correlate with poor patient survival.See related commentary by Sherman, p. 4186.


Figures

Figure 1. Human APOE levels are elevated in PDAC and correlate to patient survival. A, UMAP analysis of the 13 identified cell populations in human adjacent/normal pancreas (n = 3) and PDAC tumors (n = 16). B, Dot plot of APOE in all identified cell populations in human single-cell data set. Color represents average expression. Size of the dot represents expression frequency. C, UMAP visualization of four identified myeloid cell subpopulations in the human PDAC tissue. D, Feature plot of APOE expression in all identified myeloid cell populations in human PDAC. Gray, low expression; blue, high expression. Black outline denotes APOE-positive macrophages. E, Violin plot of normalized gene expression of APOE in PDAC and adjacent normal pancreas macrophages in human PDAC. Statistical significance was determined using nonparametric Wilcoxon rank sum test. F, UMAP visualization of human PDAC fibroblast subpopulations. G, Violin plot of normalized gene expression of APOE in human myCAF and iCAF populations. H, Violin plot of normalized gene expression of APOE in PDAC and adjacent normal pancreas iCAFs in human PDAC. Statistical significance was determined using nonparametric Wilcoxon rank sum test. I, Violin plot of normalized expression of APOE in human monocytes. Statistical significance was determined using nonparametric Wilcoxon rank sum test. J, Human APOE concentration (μg/mL) in plasma from healthy donors (n = 15), chronic pancreatitis patients (n = 17), and PDAC patients (n = 155). Statistical significance was determined using one-way ANOVA with Tukey test for multiple comparisons. n.s., not significant. K, Survival analysis of PDAC patients stratified by plasma APOE levels. APOE low, n = 32; APOE high, n = 32. Statistical significance was determined using log-rank (Mantel–Cox) test.
Figure 1.
Human APOE levels are elevated in PDAC and correlate to patient survival. A, UMAP analysis of the 13 identified cell populations in human adjacent/normal pancreas (n = 3) and PDAC tumors (n = 16). B, Dot plot of APOE in all identified cell populations in human single-cell data set. Color represents average expression. Size of the dot represents expression frequency. C, UMAP visualization of four identified myeloid cell subpopulations in the human PDAC tissue. D, Feature plot of APOE expression in all identified myeloid cell populations in human PDAC. Gray, low expression; blue, high expression. Black outline denotes APOE-positive macrophages. E, Violin plot of normalized gene expression of APOE in PDAC and adjacent normal pancreas macrophages in human PDAC. Statistical significance was determined using nonparametric Wilcoxon rank sum test. F, UMAP visualization of human PDAC fibroblast subpopulations. G, Violin plot of normalized gene expression of APOE in human myCAF and iCAF populations. H, Violin plot of normalized gene expression of APOE in PDAC and adjacent normal pancreas iCAFs in human PDAC. Statistical significance was determined using nonparametric Wilcoxon rank sum test. I, Violin plot of normalized expression of APOE in human monocytes. Statistical significance was determined using nonparametric Wilcoxon rank sum test. J, Human APOE concentration (μg/mL) in plasma from healthy donors (n = 15), chronic pancreatitis patients (n = 17), and PDAC patients (n = 155). Statistical significance was determined using one-way ANOVA with Tukey test for multiple comparisons. n.s., not significant. K, Survival analysis of PDAC patients stratified by plasma APOE levels. APOE low, n = 32; APOE high, n = 32. Statistical significance was determined using log-rank (Mantel–Cox) test.
Figure 2. APOE is highly expressed by TAM. A, IHC analysis of APOE in human benign pancreas and PDAC samples. Scale bars, 100 μm. B, Quantitation of positive APOE staining as a percentage of area in a 20× field of view. At least three fields of view were averaged per sample. Adjacent/normal pancreas, n = 3; hPDA, n = 4. Statistical significance was determined using two-tailed t test. C, IHC analysis of APOE in normal mouse pancreas and orthotopic KPC tumor. Scale bars, 100 μm. D, Quantitation of positive APOE staining as a percentage of area in a 20× field of view. Five fields of view were averaged per mouse. Control, n = 3; orthotopic tumor, n = 6. Statistical significance was determined using two-tailed t test. E, UMAP visualization of 9 identified populations in orthotopic KPC tumors (n = 2). F, Violin plot of normalized expression of Apoe in identified cell populations in orthotopic KPC tumors (n = 2). G, Coimmunofluorescence of orthotopic KPC tumor with single channels of APOE (green), F4/80 (red), αSMA (white), and merge to show APOE and F4/80 colocalization. Two examples of APOE and F4/80 colocalization are denoted by white arrowheads. Scale bars, 25 μm. H, Experimental design for bone marrow–derived macrophage polarization assay. I, qRT-PCR analysis of Apoe mRNA levels relative to Cyclophilin A in four macrophage conditions (M0, M1, M2, and TAM). Statistical significance was determined using one-way ANOVA with Tukey test for multiple correction.
Figure 2.
APOE is highly expressed by TAM. A, IHC analysis of APOE in human benign pancreas and PDAC samples. Scale bars, 100 μm. B, Quantitation of positive APOE staining as a percentage of area in a 20× field of view. At least three fields of view were averaged per sample. Adjacent/normal pancreas, n = 3; hPDA, n = 4. Statistical significance was determined using two-tailed t test. C, IHC analysis of APOE in normal mouse pancreas and orthotopic KPC tumor. Scale bars, 100 μm. D, Quantitation of positive APOE staining as a percentage of area in a 20× field of view. Five fields of view were averaged per mouse. Control, n = 3; orthotopic tumor, n = 6. Statistical significance was determined using two-tailed t test. E, UMAP visualization of 9 identified populations in orthotopic KPC tumors (n = 2). F, Violin plot of normalized expression of Apoe in identified cell populations in orthotopic KPC tumors (n = 2). G, Coimmunofluorescence of orthotopic KPC tumor with single channels of APOE (green), F4/80 (red), αSMA (white), and merge to show APOE and F4/80 colocalization. Two examples of APOE and F4/80 colocalization are denoted by white arrowheads. Scale bars, 25 μm. H, Experimental design for bone marrow–derived macrophage polarization assay. I, qRT-PCR analysis of Apoe mRNA levels relative to Cyclophilin A in four macrophage conditions (M0, M1, M2, and TAM). Statistical significance was determined using one-way ANOVA with Tukey test for multiple correction.
Figure 3. Loss of APOE results in reduced tumor burden and fibrosis. A, Experimental scheme for orthotopic transplantation of 7940b, KPC tumor cells. B, Final tumor weight (g) in WT (n = 10) and ApoE–/− (n = 13) mice. Statistical significance was determined using two-tailed t test, with a P < 0.05 considered statistically significant. C, Representative IHC for APOE in WT and ApoE–/− mice. Scale bar, 100 μm. D, Representative IHC staining for Ki-67, cleaved caspase-3 (CC3), F4/80, and CD3 in WT and ApoE–/− mice. Scale bars, 100 μm. E, Quantitation of IHC stain as a percentage area per 20× field in WT (n = 4–8) and ApoE–/− mice (n = 5–8). Statistical significance was determined by two-tailed t tests. n.s., not significant.
Figure 3.
Loss of APOE results in reduced tumor burden and fibrosis. A, Experimental scheme for orthotopic transplantation of 7940b, KPC tumor cells. B, Final tumor weight (g) in WT (n = 10) and ApoE–/− (n = 13) mice. Statistical significance was determined using two-tailed t test, with a P < 0.05 considered statistically significant. C, Representative IHC for APOE in WT and ApoE–/− mice. Scale bar, 100 μm. D, Representative IHC staining for Ki-67, cleaved caspase-3 (CC3), F4/80, and CD3 in WT and ApoE–/− mice. Scale bars, 100 μm. E, Quantitation of IHC stain as a percentage area per 20× field in WT (n = 4–8) and ApoE–/− mice (n = 5–8). Statistical significance was determined by two-tailed t tests. n.s., not significant.
Figure 4. ApoE−/− mice have fewer monocytic-MDSCs and increased CD8+ T-cell infiltration. A, Experimental scheme for orthotopic transplantation of 7940b, KPC tumor cells. B, tSNE visualization of the 6 cell populations identified using CyTOF in WT and ApoE–/− tumors. Populations identified include macrophages (blue), immature myeloid cells (orange), CD8 T cells (green), CD4 T cells (red), B cells (purple), and nonimmune (brown). C, Manual gating quantitation of cell populations in WT (n = 5–6) and ApoE–/− (n = 7) tumors. Populations include total immune (CD45+), B cells (CD45+ CD19+), total myeloid (CD45+ CD11b+), macrophages (CD11b+ F4/80+), TAMs (F4/80+ CD206+; F4/80+ PD-L1+), granulocytic-MDSCs (Ly-6C+ Ly6G+), monocytic-MDSCs (Ly-6C+ Ly-6G−), total T cells (CD45+ CD3+), CD4 T cells (CD3+ CD4+), Tregs (CD4+ CD25+), and CD8 T cells (CD3+ CD8+). D, Representative immunofluorescence staining of CD8 (green) and DAPI (blue) in WT and ApoE−/− tumors. Scale bars, 100 μm. Right, quantitation of percent CD8-positive area in a 20× field in WT (n = 4) and ApoE–/− mice (n = 5). Statistical significance was determined by two-tailed t test. E, Representative coimmunofluorescence staining of CD8 (green), GZMB (red), and DAPI (blue) in WT and ApoE–/− tumors. Scale bars, 50 μm. Right, quantitation of the number of Gzmb+ CD8+ double-positive cells in at least three, 40× fields in WT (n = 4) and ApoE–/− mice (n = 4). Statistical significance was determined by two-tailed t test.
Figure 4.
ApoE−/− mice have fewer monocytic-MDSCs and increased CD8+ T-cell infiltration. A, Experimental scheme for orthotopic transplantation of 7940b, KPC tumor cells. B, tSNE visualization of the 6 cell populations identified using CyTOF in WT and ApoE–/− tumors. Populations identified include macrophages (blue), immature myeloid cells (orange), CD8 T cells (green), CD4 T cells (red), B cells (purple), and nonimmune (brown). C, Manual gating quantitation of cell populations in WT (n = 5–6) and ApoE–/− (n = 7) tumors. Populations include total immune (CD45+), B cells (CD45+ CD19+), total myeloid (CD45+ CD11b+), macrophages (CD11b+ F4/80+), TAMs (F4/80+ CD206+; F4/80+ PD-L1+), granulocytic-MDSCs (Ly-6C+ Ly6G+), monocytic-MDSCs (Ly-6C+ Ly-6G), total T cells (CD45+ CD3+), CD4 T cells (CD3+ CD4+), Tregs (CD4+ CD25+), and CD8 T cells (CD3+ CD8+). D, Representative immunofluorescence staining of CD8 (green) and DAPI (blue) in WT and ApoE−/− tumors. Scale bars, 100 μm. Right, quantitation of percent CD8-positive area in a 20× field in WT (n = 4) and ApoE–/− mice (n = 5). Statistical significance was determined by two-tailed t test. E, Representative coimmunofluorescence staining of CD8 (green), GZMB (red), and DAPI (blue) in WT and ApoE–/− tumors. Scale bars, 50 μm. Right, quantitation of the number of Gzmb+ CD8+ double-positive cells in at least three, 40× fields in WT (n = 4) and ApoE–/− mice (n = 4). Statistical significance was determined by two-tailed t test.
Figure 5. Antitumor phenotype in ApoE–/− mice is rescued upon T-cell depletion. A, Experimental design schematic for T-cell depletion in WT and ApoE–/− mice. B, Final tumor weight (g) from WT (n = 6), WT anti-CD4/CD8 (n = 3), ApoE–/− (n = 6), and ApoE–/− anti-CD4/CD8 (n = 6). Statistical significance was determined with a nonparametric Mann–Whitney test. C, Representative SPADE analysis of cellular infiltrate in WT tumor. Identified populations include nonimmune cells, CD8 T cells, CD4 T cells, B cells, immature myeloid cells, macrophages, and CD11c+ myeloid cells. The SPADE plot is colored to indicate CD45 expression. Red, high expression; blue, low expression. D, Manual gating quantitation of cell populations in WT (n = 4), WT anti-CD4/CD8 (n = 2), ApoE–/− (n = 4), and ApoE–/− anti-CD4/CD8 (n = 5) tumors. Populations include CD4 T cells (CD3+ CD4+) and CD8 T cells (CD3+ CD8+) E, total myeloid cells (CD45+ CD11b+), macrophages (CD11b+ F4/80+), CD11c+ myeloid cells (CD11b+ CD11c+), and immature myeloid cells (Ly-6C+ Ly-6G+). Statistical significance was determined by two-tailed t tests between groups. F, Representative SPADE analysis colored by Ly-6G expression in WT, WT anti-CD4/CD8, ApoE−/−, and ApoE–/− anti-CD4/CD8 tumors. Red, high expression; blue, low expression.
Figure 5.
Antitumor phenotype in ApoE–/− mice is rescued upon T-cell depletion. A, Experimental design schematic for T-cell depletion in WT and ApoE–/− mice. B, Final tumor weight (g) from WT (n = 6), WT anti-CD4/CD8 (n = 3), ApoE–/− (n = 6), and ApoE–/− anti-CD4/CD8 (n = 6). Statistical significance was determined with a nonparametric Mann–Whitney test. C, Representative SPADE analysis of cellular infiltrate in WT tumor. Identified populations include nonimmune cells, CD8 T cells, CD4 T cells, B cells, immature myeloid cells, macrophages, and CD11c+ myeloid cells. The SPADE plot is colored to indicate CD45 expression. Red, high expression; blue, low expression. D, Manual gating quantitation of cell populations in WT (n = 4), WT anti-CD4/CD8 (n = 2), ApoE–/− (n = 4), and ApoE–/− anti-CD4/CD8 (n = 5) tumors. Populations include CD4 T cells (CD3+ CD4+) and CD8 T cells (CD3+ CD8+) E, total myeloid cells (CD45+ CD11b+), macrophages (CD11b+ F4/80+), CD11c+ myeloid cells (CD11b+ CD11c+), and immature myeloid cells (Ly-6C+ Ly-6G+). Statistical significance was determined by two-tailed t tests between groups. F, Representative SPADE analysis colored by Ly-6G expression in WT, WT anti-CD4/CD8, ApoE−/−, and ApoE–/− anti-CD4/CD8 tumors. Red, high expression; blue, low expression.
Figure 6. APOE regulates Cxcl1 expression in tumor cells and fibroblasts. A, Dot plot of Ldlr, Vldlr, Lrp1, and Lrp8 in orthotopic KPC samples. Color represents average expression, while size of the dot represents expression frequency. B, Dot plot of LDLR, VLDLR, LRP1, and LRP8 in human PDAC. Color represents average expression, while size of the dot represents expression frequency. C, Violin plot of normalized LDLR expression in human PDAC. D, Heat map of differentially expressed genes in in vitro 7940b KPC cells treated with vehicle (n = 3) compared with 7940b KPC cells treated with 0.3 μg/mL murine recombinant APOE (n = 3) for 48 hours. Red, high expression; blue, low expression. E, qRT-PCR analysis of Cxcl1 and Cxcl5 mRNA levels relative to Cyclophilin A in four KPC cell lines (7940b, mT3, mT4, mT5). Dotted line represents fold induction compared with vehicle-treated cells normalized to 1. Statistical significance was determined using one-way ANOVA with Tukey test for multiple correction. F, Survival analysis of PDAC patients stratified by plasma CXCL1 levels. CXCL1 low, n = 38; CXCL1 high, n = 38. Statistical significance was determined using log-rank (Mantel–Cox) test. G, qRT-PCR analysis for Cxcl1 mRNA levels relative to Cyclophilin A in WT fibroblasts (BLK6318) and CAFs (FB1) treated with vehicle (n = 2–3) or 0.3 μg/mL recombinant ApoE (n = 2–3) for 48 hours. Statistical significance was determined by two-tailed t tests. H, qRT-PCR analysis of Cxcl1 and Cxcl5 mRNA levels relative to Cyclophilin A in WT (n = 6) and ApoE–/− (n = 5) tumors. Statistical significance was determined using two-tailed t test. n.s., not significant. I, Coimmunofluorescence staining of CXCL1 (green), CK19 (red), αSMA (white), and DAPI (blue) in WT and ApoE–/− orthotopic KPC tumors. J, Experimental design schematic. K, qRT-PCR analysis of Cxcl1 mRNA levels relative to Cyclophilin A in 7940b tumor cells alone control (n = 6), 7940b cells cultured with WT macrophage CM (n = 6), 7940b cells cultured with ApoE–/− macrophage CM (n = 6), and 7940b cells cultured with ApoE–/− macrophage CM with 0.3 μg/mL recombinant ApoE (n = 3). Statistical significance was determined by two-tailed t tests between groups.
Figure 6.
APOE regulates Cxcl1 expression in tumor cells and fibroblasts. A, Dot plot of Ldlr, Vldlr, Lrp1, and Lrp8 in orthotopic KPC samples. Color represents average expression, while size of the dot represents expression frequency. B, Dot plot of LDLR, VLDLR, LRP1, and LRP8 in human PDAC. Color represents average expression, while size of the dot represents expression frequency. C, Violin plot of normalized LDLR expression in human PDAC. D, Heat map of differentially expressed genes in in vitro 7940b KPC cells treated with vehicle (n = 3) compared with 7940b KPC cells treated with 0.3 μg/mL murine recombinant APOE (n = 3) for 48 hours. Red, high expression; blue, low expression. E, qRT-PCR analysis of Cxcl1 and Cxcl5 mRNA levels relative to Cyclophilin A in four KPC cell lines (7940b, mT3, mT4, mT5). Dotted line represents fold induction compared with vehicle-treated cells normalized to 1. Statistical significance was determined using one-way ANOVA with Tukey test for multiple correction. F, Survival analysis of PDAC patients stratified by plasma CXCL1 levels. CXCL1 low, n = 38; CXCL1 high, n = 38. Statistical significance was determined using log-rank (Mantel–Cox) test. G, qRT-PCR analysis for Cxcl1 mRNA levels relative to Cyclophilin A in WT fibroblasts (BLK6318) and CAFs (FB1) treated with vehicle (n = 2–3) or 0.3 μg/mL recombinant ApoE (n = 2–3) for 48 hours. Statistical significance was determined by two-tailed t tests. H, qRT-PCR analysis of Cxcl1 and Cxcl5 mRNA levels relative to Cyclophilin A in WT (n = 6) and ApoE–/− (n = 5) tumors. Statistical significance was determined using two-tailed t test. n.s., not significant. I, Coimmunofluorescence staining of CXCL1 (green), CK19 (red), αSMA (white), and DAPI (blue) in WT and ApoE–/− orthotopic KPC tumors. J, Experimental design schematic. K, qRT-PCR analysis of Cxcl1 mRNA levels relative to Cyclophilin A in 7940b tumor cells alone control (n = 6), 7940b cells cultured with WT macrophage CM (n = 6), 7940b cells cultured with ApoE–/− macrophage CM (n = 6), and 7940b cells cultured with ApoE–/− macrophage CM with 0.3 μg/mL recombinant ApoE (n = 3). Statistical significance was determined by two-tailed t tests between groups.
Figure 7. APOE regulates tumor cell Cxcl1 production via NF-κB signaling. A, Representative Western blot analysis of 7940b KPC tumor cells that were either untreated, treated with scrambled siRNA-negative control, or with LDLR siRNA for 24 hours. α-Tubulin was used as a loading control. Normalized protein expression is denoted under each lane. B, qRT-PCR analysis of Ldlr, Cxcl1, and Cxcl5 mRNA levels relative to Cyclophilin A in 7940b KPC cells that underwent LDLR knockdown for 48 hours and were treated with 0.3 μg/mL recombinant ApoE (n = 3) for 1 hour. Statistical significance was determined using one-way ANOVA with Tukey test for multiple correction. C, Heat map of NF-κB/cytokine signatures in 7940b KPC cells treated with 0.3 μg/mL recombinant ApoE (n = 3) compared with vehicle (n = 3) for 48 hours. Red, high expression; blue, low expression. D, Representative coimmunofluorescence staining of p65 (green), CK19 (red), and DAPI (blue) in 7940b tumor cells in vitro treated with vehicle or 0.3 μg/mL recombinant ApoE for 48 hours. Scale bars, 25 μm. Quantitation of percent nuclear p65 in a 40× field in 7940b cells (n = 4) and 7940b cells treated with 0.3 μg/mL recombinant ApoE (n = 4) for 48 hours. White box represents higher magnification. Statistical significance was determined using two-tailed t tests. E, qRT-PCR analysis of Cxcl1, and Cxcl5 mRNA levels relative to Cyclophilin A in 7940b cells (n = 3), 7940b cells treated with 0.3 μg/mL recombinant ApoE for 2 hours (n = 3), 7940b cells pretreated with 5 μmol/L BAY11-7082 for 1 hour and treated with 0.3 μg/mL recombinant ApoE for 2 hours (n = 3), and 7940b cells pretreated with 10 μmol/L BAY11-7082 for 1 hour and treated with 0.3 μg/mL recombinant ApoE for 2 hours (n = 3). Statistical significance was determined using one-way ANOVA with Tukey test for multiple comparisons. F, Working model. PDAC tumors with active ApoE secretion regulate CXCL1 production from tumor cells and fibroblasts, which in turn recruits immature myeloid cells, resulting in suppression of CD8+ T-cell infiltration.
Figure 7.
APOE regulates tumor cell Cxcl1 production via NF-κB signaling. A, Representative Western blot analysis of 7940b KPC tumor cells that were either untreated, treated with scrambled siRNA-negative control, or with LDLR siRNA for 24 hours. α-Tubulin was used as a loading control. Normalized protein expression is denoted under each lane. B, qRT-PCR analysis of Ldlr, Cxcl1, and Cxcl5 mRNA levels relative to Cyclophilin A in 7940b KPC cells that underwent LDLR knockdown for 48 hours and were treated with 0.3 μg/mL recombinant ApoE (n = 3) for 1 hour. Statistical significance was determined using one-way ANOVA with Tukey test for multiple correction. C, Heat map of NF-κB/cytokine signatures in 7940b KPC cells treated with 0.3 μg/mL recombinant ApoE (n = 3) compared with vehicle (n = 3) for 48 hours. Red, high expression; blue, low expression. D, Representative coimmunofluorescence staining of p65 (green), CK19 (red), and DAPI (blue) in 7940b tumor cells in vitro treated with vehicle or 0.3 μg/mL recombinant ApoE for 48 hours. Scale bars, 25 μm. Quantitation of percent nuclear p65 in a 40× field in 7940b cells (n = 4) and 7940b cells treated with 0.3 μg/mL recombinant ApoE (n = 4) for 48 hours. White box represents higher magnification. Statistical significance was determined using two-tailed t tests. E, qRT-PCR analysis of Cxcl1, and Cxcl5 mRNA levels relative to Cyclophilin A in 7940b cells (n = 3), 7940b cells treated with 0.3 μg/mL recombinant ApoE for 2 hours (n = 3), 7940b cells pretreated with 5 μmol/L BAY11-7082 for 1 hour and treated with 0.3 μg/mL recombinant ApoE for 2 hours (n = 3), and 7940b cells pretreated with 10 μmol/L BAY11-7082 for 1 hour and treated with 0.3 μg/mL recombinant ApoE for 2 hours (n = 3). Statistical significance was determined using one-way ANOVA with Tukey test for multiple comparisons. F, Working model. PDAC tumors with active ApoE secretion regulate CXCL1 production from tumor cells and fibroblasts, which in turn recruits immature myeloid cells, resulting in suppression of CD8+ T-cell infiltration.

Comment in

Similar articles

Cited by

References

    1. Siegel RL, Miller KD, Jemal A. Cancer statistics, 2020. CA Cancer J Clin 2020;70:7–30. - PubMed
    1. Zhang Y, Crawford HC, Pasca di Magliano M. Epithelial-stromal interactions in pancreatic cancer. Annu Rev Physiol 2019;81:211–33. - PubMed
    1. Clark CE, Hingorani SR, Mick R, Combs C, Tuveson DA, Vonderheide RH. Dynamics of the immune reaction to pancreatic cancer from inception to invasion. Cancer Res 2007;67:9518–27. - PubMed
    1. Royal RE, Levy C, Turner K, Mathur A, Hughes M, Kammula US, et al. . Phase 2 trial of single agent Ipilimumab (anti-CTLA-4) for locally advanced or metastatic pancreatic adenocarcinoma. J Immunother 2010;33:828–33. - PMC - PubMed
    1. Brahmer JR, Tykodi SS, Chow LQ, Hwu WJ, Topalian SL, Hwu P, et al. . Safety and activity of anti-PD-L1 antibody in patients with advanced cancer. N Engl J Med 2012;366:2455–65. - PMC - PubMed

Publication types

MeSH terms