. 2021 Jul 12;39(7):958-972.e8.
doi: 10.1016/j.ccell.2021.04.017. Epub 2021 May 27.

N6-Methyladenosine on mRNA facilitates a phase-separated nuclear body that suppresses myeloid leukemic differentiation

Affiliations

N6-Methyladenosine on mRNA facilitates a phase-separated nuclear body that suppresses myeloid leukemic differentiation

Yuanming Cheng et al. Cancer Cell. .

Abstract

N6-Methyladenosine (m6A) on mRNAs mediates different biological processes and its dysregulation contributes to tumorigenesis. How m6A dictates its diverse molecular and cellular effects in leukemias remains unknown. We found that YTHDC1 is the essential m6A reader in myeloid leukemia from a genome-wide CRISPR screen and that m6A is required for YTHDC1 to undergo liquid-liquid phase separation and form nuclear YTHDC1-m6A condensates (nYACs). The number of nYACs increases in acute myeloid leukemia (AML) cells compared with normal hematopoietic stem and progenitor cells. AML cells require the nYACs to maintain cell survival and the undifferentiated state that is critical for leukemia maintenance. Furthermore, nYACs enable YTHDC1 to protect m6A-mRNAs from the PAXT complex and exosome-associated RNA degradation. Collectively, m6A is required for the formation of a nuclear body mediated by phase separation that maintains mRNA stability and control cancer cell survival and differentiation.

Keywords: RNA methylation; RNA-binding proteins; differentiation; myeloid leukemia; phase separation.


Conflict of interest statement

Declaration of interests S.R.J. is a scientific founder of Gotham Therapeutics and has equity in this company. D. J. P. is a consultant for Ventus Therapeutics. M.G.K. is a consultant for Accent Therapeutics and M.G.K.’s laboratory receives some financial support from 28-7. These disclosures are not directly related to these studies. There is a patent pending.

Figures
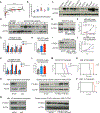
Figure 1:
Figure 1:. YTHDC1 is required for leukemia cell survival
(A) CRISPR score rank of the m6A “readers” in MOLM13 cells. m6A readers are highlighted in red and METTL3 was a control. (B) YTHDC1 expression in human primary AML cases with inv(16), t(8;21) t(15;17), t(11;19) or normal controls (NC). Data is from GSE34184 and GSE30285. (C) Immunoblot analysis YTHDC1 protein expression in AML cell lines compared to normal HSPCs (CD34+ cells). (D) Immunoblot analysis of YTHDC1 protein abundance in primary AML patient cells and peripheral blood and bone marrow from healthy donors. (E-H) MOLM13 cells were transduced with lentiviruses expressing control shRNA(shCtrl) or two independent shRNAs targeting YTHDC1 (sh1 and sh2; YTHDC1-knockdown). n=3 independent replicants. (E) Representative immunoblot for control and YTHDC1 depleted MOLM13 cells. (F) Cell proliferation of control versus YTHDC1 depleted MOLM13 cells. (G) Myeloid differentiation of cells was quantified by flow cytometry. (H) Apoptotic cells were determined by flow cytometry analysis of Annexin V and 7-AAD staining. (I-L) OCIAML3 cells were transduced with lentiviruses expressing control shRNA(shCtrl) or two independent shRNAs targeting YTHDC1 (sh1 and sh2; YTHDC1-knockdown). n=3 independent replicants. (I) Immunoblot of YTHDC1 expression in OCIAML3 cells. (J) Cell proliferation of OCIAML3 cells upon YTHDC1 depletion. (K) Myeloid differentiation of OCIAML3 cells was determined by flow cytometry. (L) Apoptotic cells were determined by flow cytometry analysis of Annexin V and 7-AAD staining. (M) Survival curve of NSG mice transplanted with control or YTHDC1 depleted MOLM13 cells by shRNA. n=10 for each group. (N) Survival curves of NSG mice xeno-transplanted with human primary AML deprived cells (AML 9 cells) that were transduced with control or YTHDC1-targeting shRNA. n=5 for each group. (O) Immunoblot of PDX cells before injection to NSG mice or after xenograft in (N). (P) Survival curves in of NSG mice xeno-transplanted with AML 10 cells that were transduced with control or YTHDC1-targeting shRNA. n=10 for each group. (Q) Immunoblot of PDX cells before injection to NSG mice or after xenograft in (P). Error bars, s.e.m. *p<0.05, **p<0.01, ***p<0.001, two-tailed t test.
Figure 2:
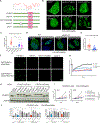
Figure 2:. YTHDC1 proteins undergo liquid-liquid phase separation in vitro and in vivo
(A) Immunofluorescence (IF) imaging of YTHDC1 in OCIAML3 cells shows nuclear YTHDC1 puncta. YTHDC1: green, DAPI: blue. Scale bars, 5μm. (B) Quantitative summary of YTHDC1 condensates in CB-CD34+, MOLM13 and OCIAML3 cells by IF. Mean+s.e.m, n=21,25,25 from 3 independent experiments. (C) Quantitative summary of fluorescence intensity per condensate in CB-CD34+, MOLM13 and OCIAML3 cells by IF. Mean+s.e.m, n=304,333,365. (D) Time-lapse images to show phase separation of YTHDC1 protein. Scale bars, 5μm. (E) Top: Quantification of FRAP data for YTHDC1-m6A RNA droplets. The bleaching event occurs at t = 0 s. Mean+s.e.m, n= 5; Bottom: representative images of fluorescence recovery. Scale bars, 2μm. (F) Time-lapse images of YTHDC1-m6A RNA droplets showing a droplet fusion event at indicated time. Scale bars, 2μm. (G) Live imaging of endogenously tagged EGFP-YTHDC1 in OCIAML3 cells. The white line highlights the nuclear periphery. Left: 2D image. Right:3D image. Scale bars, 5μm. (H) Left: Quantification of FRAP. Mean+ s.e.m, n=3. Right: representative images of fluorescence recovery. Scale bars, 5μm.
Figure 3:
Figure 3:. m6A dependent nYACs are essential for leukemia cell survival and differentiation
(A) Top: Graphs plotting intrinsic disorder for YTHDC1. PONDR (Predictor of Natural Disordered Regions) VSL2 scores are shown on the y axis, and amino acid positions are shown on the x axis. Bottom: Schematic of EGFP fused WT YTHDC1 and different YTHDC1 mutants used in this study. Pink boxes indicate the YTH domain. Green boxes indicate predicted IDRs. (B) Live imaging of 293T cells expressing EGFP fused WT YTHDC1 and different YTHDC1 mutants as indicated. The white line highlights the cell nuclear. Scale bars, 5μm. (C) Quantitative summary of YTHDC1 condensates in 293T cells related to (B). ND: not detected. Mean+s.e.m, n=16,15,17 from 3 independent experiments. (D) Live imaging of WT and Mettl3 KO MEF cells transfected with EGFP–YTHDC1 or EGFP as control. Scale bars, 5μm. (E) Quantitative summary of YTHDC1 condensates in WT and Mettl3 KO cells related to (D). Mean+s.e.m, n=29,39 from 2 independent experiments. (F) In vitro phase separation of YTHDC1 and its mutants proteins. Top: 2μM YTHDC1 protein plus 40nM 65-nucleotide non-m6A RNA. Bottom: 2μM YTHDC1 protein plus 40nM 65-nucleotide RNA containing 10 m6A nucleotides. Scale bars, 5μm. (G) Quantification of FRAP data for droplets of YTHDC1 and its mutants plus m6A RNA as indicated. The bleaching event occurs at t = 0 s. For YTHDC1 and Δpoly E, n=9; for W377A, W428A, n=6. (H-J) OCIAML3 cells overexpressed with EGFP (control), WT YTHDC1 or different YTHDC1 mutants as indicated were followed endogenous YTHDC1 knockdown by viral transduction. n=3 independent experiments. (H) Representative immunoblot probed with indicated antibodies. (I) Cell numbers measured over time of OCIAML3 cells. (J) Quantitative summary of myeloid differentiation determined by flow cytometry using CD13 (left) and CD14 (right) in OCIAML3 cells. Error bars, s.e.m. *p<0.05, **p<0.01, ***p<0.001, two-tailed t test.
Figure 4:
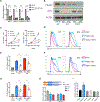
Figure 4:. YTHDC1 contributes to human HSPC myeloid differentiation.
(A-I) Human CB-CD34+ cells were transduced with lentiviruses expressing control shRNA or two independent shRNAs targeting YTHDC1. Cells were used for following experiments after puromycin selection. n=3 independent experiments. (A) Immunoblot of YTHDC1 expression in CB-CD34+ cells. (B) Cell proliferation of control and YTHDC1 depleted CB-CD34+ cells were determined. (C) Colony forming assay of control and YTHDC1 depleted HSPCs. The total number of colony forming units (CFUs) was scored two weeks after plating. (D) Apoptotic cells were determined by flow cytometry at day four and six post-transduction. (E-G) Myeloid differentiation of CB-CD34+ cells was measured by flow cytometry using CD11b, CD13, CD14 and CD33 as markers at indicated timepoint. Representative flow plot was shown in (E). (H and I) Erythroid differentiation of CB-CD34+ cells was measured by flow cytometry using CD71 and glycophorin A(GYPA) as markers at indicated timepoint. (J-L) CB-CD34+ cells were transduced with lentiviruses expressing control, YTHDC1 and its different mutants as indicated. Sorted cells were used for following experiments. n=3 independent experiments. (J) Representative immunoblot of YTHDC1 expression in indicated CB-CD34+ cells. (K) Cell proliferation of CB-CD34+ cells were determined. (L) Cells in (K) were plated on methylcellulose (5000 cells for each replicate). The total number of colony forming units (CFUs) was scored two weeks after plating. Error bars, s.e.m. * p<0.05, **p<0.01, ***p<0.001, two-tailed t test.
Figure 5:
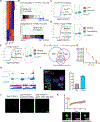
Figure 5:. YTHDC1 and nYACs are essential for maintaining mRNA abundance of its targets.
(A) Significant differentially expressed genes upon YTHDC1 depletion in MOLM13 cells by RNA-seq were shown as heatmap. n=3 independent replicants. (B) Gene set enrichment analysis of differentially expressed genes upon YTHDC1 depletion with differentially expressed genes upon METTL3 knockdown in MOLM13 cells. (C) Cumulative distribution (left) and boxplots (right) to show the abundance of m6A methylated and non-methylated transcripts upon YTHDC1 knockdown. (D-E) Cumulative distribution (left) and boxplots (right) to show the abundance of YTHDC1 binding and non-binding transcripts upon YTHDC1 depletion. These binding targets were identified by Hyper-TRIBE of YTHDC1 in (D) and by iCLIP in (E). (F) Venn diagram shows overlapped genes 1: genes containing YTHDC1 binding sits identified by iCLIP; 2: genes containing at least 1 m6A site mapped by miCLIP; 3: downregulated genes upon YTHDC1 depletion. (G) Transcription factors that enriched with overlapped 435 genes from (F). (H) Gene tracks displaying the iCLIP(YTHDC1 binding sites) and miCLIP(m6A sites) read coverage at the MYC locus. (I) Left: Representative 3D image of of MYC mRNAs (magenta) by FISH and YTHDC1 (green) by IF and DAPI (blue). Scale bars, 5μm. Right: Quantitative summary of colocalization of total or nuclear MYC mRNAs with YTHDC1 protein. (J) In vitro phase separation of YTHDC1 protein as well as YTHDC1 protein plus 200nt MYC RNA with no m6A sites or 4 m6A sites. Scale bars, 5μm. (K) Top: Quantification of FRAP data for YTHDC1-m6A MYC RNA droplets in (J). The bleaching event occurs at t = 0 s. Mean+s.e.m, n= 7. Bottom: Representative images showing FRAP. Scale bars, 2μm.
Figure 6:
Figure 6:. MYC is a functional target of YTHDC1 in AML.
(A) qPCR to measure mRNA expression of YTHDC1 targets in MOLM13 cells upon YTHDC1 depletion. n=3 independent experiments. (B-G) OCIAML3 cells overexpressing empty vector (EV) or MYC as indicated were followed with endogenous YTHDC1 knockdown by viral transduction. EV is used as control for overexpression. shCtrl is used as control for shRNAs. n=3 independent experiments. (B) Representative immunoblot in OCIAML3 cells probed with indicated antibodies. (C) Cell proliferation of OCIAML3 cells. (D-G) Myeloid differentiation of OCIAML3 cells. (D) and (F): Representative flow plot to show expression of myeloid marks CD13 and CD14. (E) and (G): Quantitative summary of myeloid differentiation using CD13 (E) and CD14 (G) determined by flow cytometry. (H) Up: Diagram of vector used in luciferase reporter assay. Bottom: Luciferase reporter assay using the original MYC CDS or the m6A sites mutated MYC CDS in 293T cells. 293T cells were transfected with control or YTHDC1 shRNA constructs. Normalized luciferase activity was calculated. n=4 independent experiments. (I) Luciferase constructs are the same as (H). 293T cells were transfected with control vector (EGFP), YTHDC1, or indicated YTHDC1 mutants. Normalized luciferase activity was calculated. n=4 independent experiments. Mean and s.e.m are shown (*, P < 0.05; **, P < 0.01; ***, P < 0.001, ****, P < 0.0001). two-tailed t test.
Figure 7:
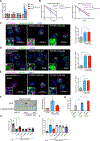
Figure 7:. nYACs protect mRNAs from the PAXT complex and exosome mediated degradation.
(A) Analysis of nascent RNA synthesis of specific genes in control or YTHDC1 depleted MOLM13 cells. n=3 independent experiments. (B) The mRNA half-life (t1/2) of MYC and GINS1 transcripts in control and YTHDC1 depleted cells. n=3 independent experiments. (C-E) Left: Representative 3D images of MYC mRNA (magenta) by FISH con-staining with exosome protein RRP6 (C) or PAXT protein PABPN1 (D) or PAXT protein MTR4 (E) (green) by IF and DAPI (blue) in control and YTHDC1 depleted cells. White dots indicate co-localization between MYC mRNA and protein as indicated. Scale bars, 5μm. Right: Quantitative summary of co-localization of MYC mRNA with indicated protein (n=10). (F) Left: m6A dot blot assays of PABPN1 binding RNAs by RNA-Immunoprecipitation (RIP) from control and YTHDC1 depleted MOLM13 cells. Right: Quantitative summary of m6A level of PABPN1 binding RNAs by RIP. n=3 independent experiments. (G) qPCR of PABPN1-RIP recovered RNA at MYC locus in control and YTHDC1 depleted MOLM13 cells. IgG served as a non-specific binding control. n=3 independent experiments. (H and I) OCIAML3 cells overexpressed with control, WT YTHDC1 or different YTHDC1 mutants as indicated were followed endogenous YTHDC1 knockdown by viral transduction. n=3 independent experiments. (H) Quantitative summary of MYC mRNA by RNA-FISH. (I) Quantitative summary of co-localization of MYC mRNA and PABPN1 protein. Error bars, s.e.m. *p<0.05, **p<0.01, ***p<0.001, two-tailed t test.

Comment in

  • m6A nuclear condensates support AML.
    Zlotorynski E. Zlotorynski E. Nat Rev Mol Cell Biol. 2021 Jul;22(7):442. doi: 10.1038/s41580-021-00385-3. Nat Rev Mol Cell Biol. 2021. PMID: 34079105 No abstract available.

Similar articles

Cited by

References

    1. Alberti S, and Dormann D (2019). Liquid-Liquid Phase Separation in Disease. Annu Rev Genet 53, 171–194. - PubMed
    1. Banani SF, Lee HO, Hyman AA, and Rosen MK (2017). Biomolecular condensates: organizers of cellular biochemistry. Nat Rev Mol Cell Biol 18, 285–298. - PMC - PubMed
    1. Bansal H, Yihua Q, Iyer SP, Ganapathy S, Proia DA, Penalva LO, Uren PJ, Suresh U, Carew JS, Karnad AB, et al. (2014). WTAP is a novel oncogenic protein in acute myeloid leukemia. Leukemia 28, 1171–1174. - PMC - PubMed
    1. Barbieri I, Tzelepis K, Pandolfini L, Shi J, Millan-Zambrano G, Robson SC, Aspris D, Migliori V, Bannister AJ, Han N, et al. (2017). Promoter-bound METTL3 maintains myeloid leukaemia by m(6)A-dependent translation control. Nature 552, 126–131. - PMC - PubMed
    1. Bedi RK, Huang D, Eberle SA, Wiedmer L, Sledz P, and Caflisch A (2020). Small-Molecule Inhibitors of METTL3, the Major Human Epitranscriptomic Writer. ChemMedChem 15, 744–748. - PubMed

Publication types

MeSH terms