. 2021 May 25;35(8):109187.
doi: 10.1016/j.celrep.2021.109187.

Immunity-longevity tradeoff neurally controlled by GABAergic transcription factor PITX1/UNC-30

Affiliations

Immunity-longevity tradeoff neurally controlled by GABAergic transcription factor PITX1/UNC-30

Benson Otarigho et al. Cell Rep. .

Abstract

A body of evidence indicates that metazoan immune and aging pathways are largely interconnected, but the mechanisms involved in their homeostatic control remain unclear. In this study, we find that the PITX (paired-like homeodomain) transcription factor UNC-30 controls the tradeoff between immunity and longevity from the nervous system in Caenorhabditis elegans. PITX/UNC-30 functional loss enhances immunity in a GATA/ELT-2- and p38 MAPK/PMK-1-dependent manner and reduced longevity by activating MXD/MDL-1 and the C2H2-type zinc finger transcription factor PQM-1. The immune inhibitory and longevity stimulatory functions of PITX/UNC-30 require the sensory neuron ASG and a signaling pathway controlled by NPR-1, which is a G protein-coupled receptor related to mammalian neuropeptide Y receptors. Our findings uncover a suppressive role of GABAergic signaling in the neural control of a biological tradeoff where energy is allocated toward immunity at the expense of longevity.

Keywords: C. elegans; GABAergic; P. aeruginosa; immunity; infection; innate; longevity; neuropeptides; neurotransmitters; tradeoff.


Conflict of interest statement

Declaration of interests The authors declare no competing interests.

Figures

Figure 1.
Figure 1.. UNC-30 functional loss exhibits enhanced immunity and reduced longevity
(A) Wild-type (WT) and unc-30(ok613) animals were exposed to P. aeruginosa partial lawn and scored for survival (n = 60). WT versus unc-30(ok613), p < 0.0001. (B) Colonization of WT, unc-30(ok613), and unc-30(ok613);Prab-3::unc-30 animals by P. aeruginosa-GFP after 24 h at 25°C (n = 10). Scale bar, 200 μm. (C) Colony-forming units per animal (WT, unc-30(ok613), and unc-30(ok613);Prab-3::unc-30) grown on P. aeruginosa-GFP for 24 h at 25°C (n = 10). Bars represent means while error bars indicate SD; ****p < 0.001 and NS, not significant (p > 0.05). Ten animals were used for each condition. (D) WT, unc-30(ok613), and unc-30(ok613);Prab-3::unc-30 animals were exposed to live E. coli and scored for survival (n = 120). WT versus unc-30(ok613), p < 0.0001; unc-30(ok613);Prab-3::unc-30, p = NS. (E) WT, unc-30(ok613), and unc-30(ok613);Prab-3::unc-30 animals were exposed to UV-killed E. coli and scored for survival (n = 120). WT versus unc-30(ok613), p < 0.0001; unc-30(ok613);Prab-3::unc-30, p = NS. (F) RNAi intestine-specific strain MGH171, MGH171;unc-30 RNAi, and unc-30(ok613) animals were exposed to P. aeruginosa full lawn and scored for survival. EV, empty vector RNAi control (n = 60). MGH171 EV versus unc-30(ok613) EV, p < 0.0001; MGH171;unc-30 RNAi, p = NS. (G) WT, unc-30(ok613), unc-30(ok613);Punc-30::unc-30, and unc-30(ok613);Prab-3::unc-30 animals were exposed to P. aeruginosa partial lawn and scored for survival (n = 60). WT versus unc-30(ok613), p < 0.0001; unc-30(ok613);Punc-30::unc-30, and unc-30(ok613);Prab-3::unc-30, p = NS. (H) WT, unc-30(ok613), unc-30(ok613);Punc-30::unc-30, and unc-30(ok613);Prab-3::unc-30 animals were exposed to S. enterica partial lawn and scored for survival (n = 60). WT versus unc-30(ok613), p < 0.0001; unc-30(ok613);Punc-30::unc-30, and unc-30(ok613);Prab-3::unc-30, p = NS. (I) WT, unc-30(ok613), unc-30(ok613);Punc-30::unc-30, and unc-30(ok613);Prab-3::unc-30 animals were exposed to S. aureus partial lawn and scored for survival (n = 60). WT versus unc-30(ok613), p < 0.0001; unc-30(ok613);Punc-30::unc-30, and unc-30(ok613);Prab-3::unc-30, p = NS. (J) WT, unc-30(ok613), unc-30(ok613);Punc-30::unc-30, and unc-30(ok613);Prab-3::unc-30 animals were exposed to P. aeruginosa full lawn and scored for survival (n = 60). WT versus unc-30(ok613), p < 0.0001; unc-30(ok613);Punc-30::unc-30, and unc-30(ok613);Prab-3::unc-30, p = NS. Figures are representative of three independent experiments. “n” represents the number of animals for each experimental condition.
Figure 2.
Figure 2.. PITX1/UNC-30 regulates immune and age determination pathways
(A) Gene Ontology analysis of upregulated genes in unc-30(ok613) versus WT in both non-infected and P. aeruginosa-infected animals (n ≈ 1,000). The cutoff is based on the filtering thresholds of p < 0.05 and arranged according to the representation factor. (B) Representation factors of immune pathways for the upregulated immune genes in unc-30(ok613) versus WT in both non-infected and P. aeruginosa-infected animals. (C) qRT-PCR analysis of immune gene expression in WT, unc-30(ok613), and unc-30(ok613);Prab-3::unc-30 animals (n ≈ 1,000). Bars represent means while error bars indicate SD of three independent experiments; *p < 0.05, **p < 0.001 and ***p < 0.0001. (D) Representation factors of age determination pathways for the upregulated aging genes in unc-30(ok613) versus WT in non-infected animals. (E) Venn diagram showing the number of genes in each age determination pathway for the upregulated aging genes in unc-30(ok613) versus WT in non-infected animals. (F) qRT-PCR analysis of age determination genes expression in WT, unc-30(ok613), and unc-30(ok613);Prab-3::unc-30 animals (n ≈ 1,000). Bars represent means while error bars indicate SD of three independent experiments; *p < 0.05, **p < 0.001 and ***p < 0.0001. (C) and (F) are representative of three independent experiments. “n” represents the number of animals for each experimental condition.
Figure 3.
Figure 3.. Functional loss of UNC-30 enhances immunity via GATA/ELT-2 and p38 MARK/PMK-1
(A) WT, daf-16 RNAi, unc-30(ok613), and unc-30(ok613);daf-16 RNAi animals were exposed to P. aeruginosa and scored for survival (n = 60). EV, empty vector RNAi control. WT EV versus unc-30(ok613) EV, p < 0.0001; daf-16 RNAi, p = NS; unc-30(ok613);daf-16 RNAi, p < 0.0001. (B) WT, pqm-1 RNAi, unc-30(ok613), and unc-30(ok613);pqm-1 animals were exposed to P. aeruginosa and scored for survival (n = 60). EV, empty vector RNAi control. WT EV versus unc-30(ok613) EV, p < 0.0001; pqm-1 RNAi, p < 0.05; unc-30(ok613);pqm-1 RNAi, p < 0.0001. (C) WT, elt-2 RNAi, unc-30(ok613), and unc-30(ok613);elt-2 RNAi animals were exposed to P. aeruginosa and scored for survival (n = 60). EV, empty vector RNAi control. WT EV versus unc-30(ok613) EV, p < 0.0001; elt-2 RNAi, p < 0.0001; unc-30(ok613);elt-2 RNAi, p < 0.0001. elt-2 RNAi versus unc-30(ok613) elt-2 RNAi, p = NS. (D) WT, pmk-1 RNAi, unc-30(ok613), and unc-30(ok613);pmk-1 RNAi animals were exposed to P. aeruginosa and scored for survival (n = 60). EV, empty vector RNAi control. WT EV versus unc-30(ok613) EV, p < 0.0001; pmk-1 RNAi, p < 0.0001; unc-30(ok613);pmk-1 RNAi, p < 0.05. pmk-1 RNAi versus unc-30(ok613) pmk-1 RNAi, p < 0.0001. (E) WT, daf-16(mu86), unc-30(ok613), and daf-16(mu86);unc-30(ok613) animals were exposed to P. aeruginosa and scored for survival (n = 60). WT versus unc-30(ok613), p < 0.0001; daf-16(mu86), p = NS; daf-16(mu86);unc-30(ok613), p < 0.0001. (F) WT, pqm-1(ok485), unc-30(ok613), and pqm-1(ok485);unc-30(ok613) animals were exposed to P. aeruginosa and scored for survival (n = 60). WT versus unc-30(ok613), p < 0.0001; pqm-1(ok485), p < 0.05; pqm-1(ok485);unc-30(ok613), p < 0.0001. (G) WT, nsy-1(ag3), unc-30(ok613), and nsy-1(ag3);unc-30(ok613) animals were exposed to P. aeruginosa and scored for survival (n = 60). WT versus unc-30(ok613), p < 0.0001; nsy-1(ag3), p < 0.0001; nsy-1(ag3);unc-30(ok613), p = NS. (H) WT, sek-1(km4), unc-30(ok613), and sek-1(km4);unc-30(ok613) animals were exposed to P. aeruginosa and scored for survival (n = 60). WT versus unc-30(ok613), p < 0.0001; sek-1(km4), p < 0.0001; sek-1(km4);unc-30(ok613), p = NS. Figures are representative of three independent experiments. “n” represents the number of animals for each experimental condition.
Figure 4.
Figure 4.. Functional loss of UNC-30 reduces longevity via MXD3/MDL-1 and PQM-1 pathways
(A) Venn diagram of the immune and aging genes upregulated in unc-30(ok613) versus WT non-infected animals. (B) Number of age determination genes upregulated in unc-30(ok613) versus WT for which mutant phenotypes have been reported. (C) WT, mdl-1(tm311), unc-30(ok613), and mdl-1(tm311);unc-30(ok613) animals were exposed to UV-killed E. coli and scored for survival (n = 120). WT versus unc-30(ok613), p < 0.0001; mdl-1(tm311), p < 0.0001; mdl-1(tm311);unc-30(ok613), p = NS. mdl-1(tm311) versus mdl-1(tm311);unc-30(ok613), p < 0.001. (D) WT, pqm-1(ok485), unc-30(ok613), and pqm-1(ok485);unc-30(ok613) animals were exposed to UV-killed E. coli and scored for survival (n = 120). WT versus unc-30(ok613), p < 0.0001; unc-30(ok613);pqm-1(ok485), p =NS . unc-30(ok613) versus unc-30(ok613);pqm-1(ok485), p < 0.05. (E) WT, unc-30(ok613), mdl-1 RNAi, and unc-30(ok613);pqm-1(ok485);mdl-1 RNAi animals were exposed to UV-killed E. coli and scored for survival (n = 120). EV, empty vector RNAi control. WT EV versus unc-30(ok613) EV, p < 0.0001; unc-30(ok613);pqm-1(ok485);mdl-1 RNAi, p < 0.001. unc-30(ok613);pqm-1(ok485);mdl-1 RNAi versus mdl-1 RNAi, p = NS. (F) WT, skn-1 RNAi, unc-30(ok613), and unc-30(ok613);skn-1 RNAi animals were exposed to UV-killed E. coli and scored for survival. EV, empty vector RNAi control (n = 120). WT EV versus unc-30(ok613) EV, p < 0.0001; skn-1 RNAi, p < 0.001; unc-30(ok613);skn-1 RNAi, p < 0.0001. skn-1 RNAi versus unc-30(ok613);skn-1 RNAi, p < 0.001. (C)–(F) are representative of three independent experiments. “n” represents the number of animals for each experimental condition.
Figure 5.
Figure 5.. PITX1/UNC-30 regulates immunity and longevity via neuropeptide signaling
(A) Representation factors of neuropeptide genes upregulated in non-infected and P. aeruginosa-infected unc-30(ok613) versus WT animals. (B) qRT-PCR analysis of neuropeptide gene expression in WT, unc-30(ok613), and unc-30(ok613);Prab-3::unc-30 animals (n ≈ 1,000). Bars represent means while error bars indicate SD; *p < 0.05, **p < 0.001, ***p < 0.0001 and ns, not significant (p > 0.05). (C) WT, npr-1(ad609), unc-30(ok613), and npr-1(ad609);unc-30(ok613) animals were exposed to P. aeruginosa and scored for survival (n = 60). WT versus unc-30(ok613), p < 0.0001; npr-1(ad609), p < 0.001; npr-1(ad609);unc-30(ok613), p < 0.05. npr-1(ad609) versus npr-1(ad609)::unc-30(ok613), p = NS. (D) WT, npr-1(ad609), unc-30(ok613), and unc-30(ok613);npr-1(ad609) animals were exposed to UV-killed E. coli and scored for survival (n = 120). WT versus unc-30(ok613) p < 0.0001; npr-1(ad609), p = NS. While npr-1(ad609) versus unc-30(ok613), p < 0.0001; unc-30(ok613);npr-1(ad609), p = NS. (E) Representation factors of immune genes downregulated in npr-1(ad609) versus WT. (F) qRT-PCR analysis of expression of age determination genes in WT, npr-1(ad609), unc-30(ok613), and unc-30(ok613);npr-1(ad609) animals (n ≈ 1,000). Bars represent means while error bars indicate SD; *p < 0.05, **p < 0.001, ***p < 0.0001, and ns, not significant (p > 0.05). (B)–(D) and (F) are representative of three independent experiments. “n” represents the number of animals for each experimental condition.
Figure 6.
Figure 6.. ASG neurons control the immunity-longevity tradeoff
(A) WT, PVP(−), and unc-30(ok613) animals were exposed to P. aeruginosa and scored for survival (n = 60). WT versus PVP(−), p = NS. (B) WT, unc-30(ok613), ASG(−), and ASG−);unc-30(ok613) animals were exposed to P. aeruginosa and scored for survival (n = 60). WT versus ASG(−), p < 0.0001; ASG−);unc-30(ok613), p < 0.0001. While ASG(−) versus ASG(−);unc-30(ok613), p = NS. (C) WT, unc-30(ok613), unc-30(ok613);Pgyc-15::unc-30 animals were exposed to P. aeruginosa and scored for survival (n = 60). WT versus unc-30(ok613);Pgyc-15::unc-30, p = NS. (D) qRT-PCR analysis of immune gene expression in WT and ASG(−) animals (n ≈ 1000). Bars represent means while error bars indicate SD; **p < 0.001 and ***p < 0.0001. (E) WT, ASG(−), PVP(−), and unc-30(ok613) animals were exposed to UV-killed E. coli and scored for survival (n = 120). WT versus ASG(−), p < 0.0001; unc-30(ok613), p < 0.0001. (F) WT, ASG(−), ASG−);unc-30(ok613), and unc-30(ok613) animals were exposed to UV-killed E. coli and scored for survival (n = 120). WT versus ASG(−), p < 0.0001; unc-30(ok613), p < 0.0001. unc-30(ok613) versus ASG(−)::unc-30(ok613), p < 0.001. (G) WT, unc-30(ok613), unc-30(ok613);Pgyc-15::unc-30 animals were exposed to UV-killed E. coli and scored for survival (n = 120). WT versus unc-30(ok613);Pgyc-15::unc-30, p = NS. Figures are representative of three independent experiments. “n” represents the number of animals for each experimental condition.
Figure 7.
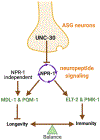
Figure 7.. Model for neuronal control of the tradeoff between immunity and longevity via neuropeptide signaling in C. elegans
Neuronal PITX1/UNC-30, via NPR-1, inhibits immunity by preventing the expression of ELT-2- and PMK-1-dependent immune genes and promotes longevity by preventing the expression of MDL-1 and PQM-1-dependent age-related genes.

Similar articles

Cited by

References

    1. Aballay A, Drenkard E, Hilbun LR, and Ausubel FM (2003). Caenorhabditis elegans innate immune response triggered by Salmonella enterica requires intact LPS and is mediated by a MAPK signaling pathway. Curr. Biol 13, 47–52. - PubMed
    1. Afgan E, Baker D, van den Beek M, Blankenberg D, Bouvier D, Čech M, Chilton J, Clements D, Coraor N, Eberhard C, et al. (2016). The Galaxy platform for accessible, reproducible and collaborative biomedical analyses: 2016 update. Nucleic Acids Res. 44 (W1), W3–W10. - PMC - PubMed
    1. Afgan E, Baker D, Batut B, van den Beek M, Bouvier D, Čech M, Chilton J, Clements D, Coraor N, Grüning BA, et al. (2018). The Galaxy platform for accessible, reproducible and collaborative biomedical analyses: 2018 update. Nucleic Acids Res. 46 (W1), W537–W544. - PMC - PubMed
    1. Alcedo J, and Kenyon C (2004). Regulation of C. elegans longevity by specific gustatory and olfactory neurons. Neuron 41, 45–55. - PubMed
    1. Amrit FR, and Ghazi A (2017). Transcriptomic Analysis of C. elegans RNA Sequencing Data Through the Tuxedo Suite on the Galaxy Project. J. Vis. Exp (122), 55473. - PMC - PubMed

Publication types

MeSH terms

LinkOut - more resources