Cellular lensing and near infrared fluorescent nanosensor arrays to enable chemical efflux cytometry
- PMID: 34035262
- PMCID: PMC8149711
- DOI: 10.1038/s41467-021-23416-1
Cellular lensing and near infrared fluorescent nanosensor arrays to enable chemical efflux cytometry
Abstract
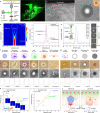
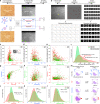
Nanosensors have proven to be powerful tools to monitor single cells, achieving spatiotemporal precision even at molecular level. However, there has not been way of extending this approach to statistically relevant numbers of living cells. Herein, we design and fabricate nanosensor array in microfluidics that addresses this limitation, creating a Nanosensor Chemical Cytometry (NCC). nIR fluorescent carbon nanotube array is integrated along microfluidic channel through which flowing cells is guided. We can utilize the flowing cell itself as highly informative Gaussian lenses projecting nIR profiles and extract rich information. This unique biophotonic waveguide allows for quantified cross-correlation of biomolecular information with various physical properties and creates label-free chemical cytometer for cellular heterogeneity measurement. As an example, the NCC can profile the immune heterogeneities of human monocyte populations at attomolar sensitivity in completely non-destructive and real-time manner with rate of ~600 cells/hr, highest range demonstrated to date for state-of-the-art chemical cytometry.
Conflict of interest statement
The authors declare no competing interests.
Figures


Similar articles
-
Single-molecule detection of H₂O₂ mediating angiogenic redox signaling on fluorescent single-walled carbon nanotube array.ACS Nano. 2011 Oct 25;5(10):7848-57. doi: 10.1021/nn201904t. Epub 2011 Sep 21. ACS Nano. 2011. PMID: 21899329 Free PMC article.
-
Nanosensor Chemical Cytometry for Characterizing the Efflux Heterogeneity of Nitric Oxide from Macrophages.ACS Nano. 2021 Aug 24;15(8):13683-13691. doi: 10.1021/acsnano.1c04958. Epub 2021 Aug 16. ACS Nano. 2021. PMID: 34398614
-
High Spatiotemporal Precision Mapping of Optical Nanosensor Array Using Machine Learning.ACS Sens. 2024 Oct 25;9(10):5489-5499. doi: 10.1021/acssensors.4c01763. Epub 2024 Sep 25. ACS Sens. 2024. PMID: 39319474
-
Nanosensor Chemical Cytometry: Advances and Opportunities in Cellular Therapy and Precision Medicine.ACS Meas Sci Au. 2023 Nov 1;3(6):393-403. doi: 10.1021/acsmeasuresciau.3c00038. eCollection 2023 Dec 20. ACS Meas Sci Au. 2023. PMID: 38145025 Free PMC article. Review.
-
Carbon nanotube-based electrochemical biosensing platforms: fundamentals, applications, and future possibilities.Recent Pat Biotechnol. 2007;1(2):181-91. doi: 10.2174/187220807780809427. Recent Pat Biotechnol. 2007. PMID: 19075840 Review.
Cited by
-
Prospects of NIR fluorescent nanosensors for green detection of SARS-CoV-2.Sens Actuators B Chem. 2022 Jul 1;362:131764. doi: 10.1016/j.snb.2022.131764. Epub 2022 Mar 30. Sens Actuators B Chem. 2022. PMID: 35370362 Free PMC article. Review.
-
Monitoring Enzyme Activity Using Near-Infrared Fluorescent Single-Walled Carbon Nanotubes.ACS Sens. 2024 May 24;9(5):2237-2253. doi: 10.1021/acssensors.4c00377. Epub 2024 Apr 26. ACS Sens. 2024. PMID: 38669585 Free PMC article. Review.
-
Finding intracellular lipid droplets from the single-cell biolens' signature in a holographic flow-cytometry assay.Biomed Opt Express. 2022 Oct 4;13(11):5585-5598. doi: 10.1364/BOE.460204. eCollection 2022 Nov 1. Biomed Opt Express. 2022. PMID: 36733743 Free PMC article.
-
Lipid droplets as endogenous intracellular microlenses.Light Sci Appl. 2021 Dec 6;10(1):242. doi: 10.1038/s41377-021-00687-3. Light Sci Appl. 2021. PMID: 34873142 Free PMC article.
-
Cytometry in the Short-Wave Infrared.ACS Nano. 2024 Jul 16;18(28):18534-18547. doi: 10.1021/acsnano.4c04345. Epub 2024 Jul 8. ACS Nano. 2024. PMID: 38973534 Free PMC article.
References
-
- Arroyo JO, Kukura P. Non-fluorescent schemes for single-molecule detection, imaging and spectroscopy. Nat. Photonics. 2016;10:11–17. doi: 10.1038/nphoton.2015.251. - DOI
-
- Rigler, R. & Vogel, H. Single Molecules and Nanotechnology (Springer, 2008).
Publication types
MeSH terms
Substances
LinkOut - more resources
Full Text Sources
Other Literature Sources
Research Materials
Miscellaneous

