. 2021 Jul 8;6(13):e150744.
doi: 10.1172/jci.insight.150744.

Inflammatory signals are sufficient to elicit TOX expression in mouse and human CD8+ T cells

Affiliations

Inflammatory signals are sufficient to elicit TOX expression in mouse and human CD8+ T cells

Nicholas J Maurice et al. JCI Insight. .

Abstract

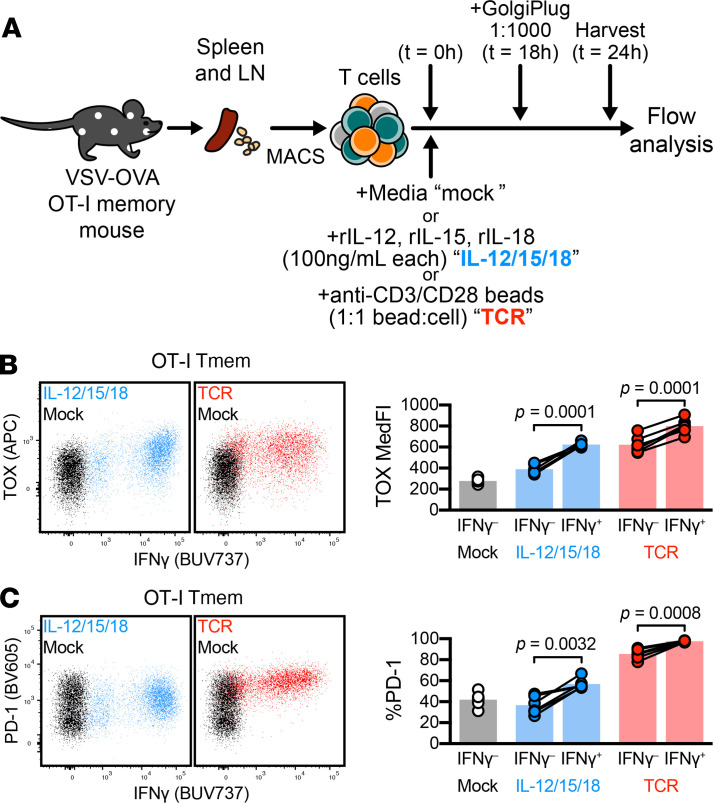
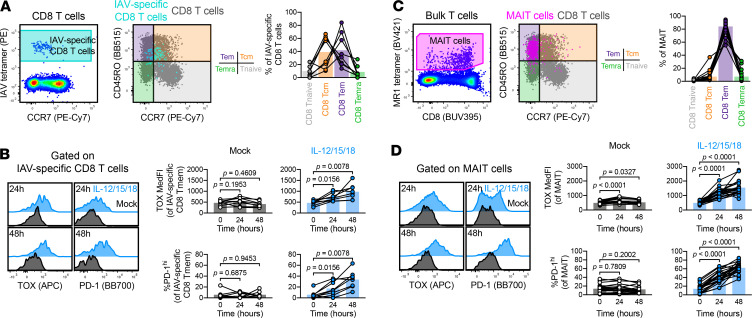
T cell receptor (TCR) stimulation leads to the expression of the transcription factor thymocyte selection-associated high-mobility group box (TOX). Prolonged TCR signaling, such as encountered during chronic infections or in tumors, leads to sustained TOX expression, which is required for the induction of a state of exhaustion or dysfunction. Although CD8+ memory T (Tmem) cells in mice typically do not express TOX at steady state, some human Tmem cells express TOX but appear fully functional. This seeming discrepancy between mouse and human T cells has led to the speculation that TOX is differentially regulated between these species, which could complicate the interpretation of preclinical mouse model studies. We report here that, similar to TCR-mediated signals, inflammatory cytokines are also sufficient to increase TOX expression in human and mouse Tmem cells. Thus, TOX expression is controlled by the environment, which provides an explanation for the different TOX expression patterns encountered in T cells isolated from specific pathogen-free laboratory mice versus humans. Finally, we report that TOX is not necessary for cytokine-driven expression of programmed cell death 1. Overall, our data highlight that the mechanisms regulating TOX expression are conserved across species and indicate that TOX expression reflects a T cell's activation state and does not necessarily correlate with T cell dysfunction.

Keywords: Immunology; Inflammation; T cells.


Conflict of interest statement

Conflict of interest: The authors have declared that no conflict of interest exists.

Figures

Figure 1
Figure 1. Cytokine stimulation induces TOX expression in murine CD8+ Tmem cells.
(A) Schematic of OT-I memory mouse generation (top) and subsequent stimulation assays (bottom). OT-I Tnaive cells were transferred and expanded with VSV-OVA, then aged to stable memory contraction; after, T cells were enriched from VSV-OVA expanded OT-I memory animals and stimulated with media alone (mock), IL-12, IL-15, and IL-18 in combination (IL-12/15/18; each at 100 ng/mL), or anti-CD3/CD28 microbeads (TCR) at an approximately 1:1 bead/cell ratio. (B and C) expression of (B) PD-1, (C) TOX, and (D) TCF1 within stimulated OT-I Tmem cells throughout experiment time course. TOX MedFI fold change in C was calculated against average TOX MedFI from mock stimulations in a subset-specific, batch-specific, and time point–specific manner. In B and C, bar chart symbols represent 1 animal at a unique time point/condition and are connected by animal identity, with bar indicating mean; the indicated statistical significances in B and C were calculated using paired t tests. In BD, symbols in line plots comparing stimulation conditions represent the mean across all animals for a specific time point/condition ± SD; the indicated statistical significances were calculated using Mann-Whitney U tests. Results from n = 14 mice across 7 experiments are shown in B and C. Results from n = 9 mice across 2 experiments are shown in D. TOX, thymocyte selection–associated high-mobility group box; Tmem, memory T cells; Tnaive, naive T cells; VSV-OVA, OVA-expressing vesicular stomatitis virus; PD-1, programmed cell death protein 1; MedFI, median fluorescence intensity.
Figure 2
Figure 2. TOX and PD-1 expression occur in functional CD8+ T cells.
ICS in tandem with TOX interrogation. (A) Experiment schematic, in which bulk T cells from VSV-OVA OT-I memory mice were stimulated (mock, black; IL-12/15/18, blue; TCR, red). Cells were treated with GolgiPlug 18 hours into stimulation and harvested for flow staining and analysis at 24 hours. (B and C) Expression of (B) TOX and (C) PD-1 in IFN-γ+ and IFN-γ OT-I Tmem cells. Representative plots depict cells from the same animal across different stimulation conditions. Symbols in B and C represent a T cell population within a unique animal with symbols connected by animal identity (n = 6 across 2 experiments). Bars represent mean and indicated statistical significances were calculated by paired t tests. TOX, thymocyte selection–associated high-mobility group box; ICS, intracellular cytokine staining; Tmem, memory T cells; VSV-OVA, OVA-expressing vesicular stomatitis virus; PD-1, programmed cell death protein 1; TCR, T cell receptor.
Figure 3
Figure 3. Cytokine-mediated TOX induction is limited in exhausted T cells.
(A and B) Changes in TOX expression within L. monocytogenes–expanded TCR-transgenic Tmem cells: OT-I, specific for OVA Ag and gBT-I, specific for gB Ag. MACS-enriched T cells from L. monocytogenes–expanded OT-I or gBT-I memory mice were stimulated with media alone (mock), recombinant IL-12, IL-15, and IL-18 in combination (IL-12/15/18; each at 100 ng/mL), or anti-CD3/CD28 microbeads (TCR) at a approximately 1:1 cell/bead ratio. (A and B) Representative TOX expression and TOX MedFI fold change during stimulation in L. monocytogenes–primed (A) OT-I and (B) gBT-I Tmem cells. (C and D) Changes in TOX expression within LCMV-specific TCR-transgenic P14 T cells expanded by acute (Armstrong) or chronic (Docile) LCMV infection. (C and D) Representative TOX expression and TOX MedFI fold change during stimulation in P14 T cells primed by (C) LCMV Armstrong and (D) LCMV Docile. TOX MedFI fold change was calculated against average TOX MedFI within mock stimulation in a batch-specific, time point–specific manner. We calculated indicated statistical significances using paired t tests. Each symbol represents a sample at a unique time point/condition, with bars delineating mean, which are connected by donor (n = 4 L. monocytogenes–OVA expanded OT-I memory mice across 2 experiments; n = 10 L. monocytogenes–gB expanded gBT-I memory mice across 2 experiments; n = 17 LCMV Armstrong-expanded P14 memory mice across 4 experiments; n = 8 LCMV Docile-expanded P14 memory mice across 2 experiments). Mouse identities are consistent between representative flow plots within the same generation/adoptive transfer condition. TOX, thymocyte selection–associated high-mobility group box; Tmem, memory T cells; LCMV, lymphocytic choriomeningitis virus; MACS, magnet-activated cell sorting; PD-1, programmed cell death protein 1; MedFI, median fluorescence intensity; TCR, T cell receptor; gB, glycoprotein B; Ag, antigen.
Figure 4
Figure 4. Inflammatory cytokines are potent inducers of TOX and PD-1 in human Tmem cells.
(A) Basal expression of TOX and PD-1 in CD8+ Tmem and Tnaive cells. (B) TOX MedFI across PD-1 low–, medium–, and high–expressing CD8+ Tmem cells. (C) Schematic detailing T cell isolation from cryopreserved PBMCs and subsequent stimulation with recombinant IL-6, IL-15, IL-12/18, and IL-12/15/18 (all at 100 ng/mL, each), or anti-CD3/CD28 microbeads (TCR, 1:1 bead/cell ratio) and subsequent flow interrogation. (D) TOX expression (MedFI) and PD-1hi frequency in CD8+ Tmem cells throughout stimulation time course. (E and F) Comparison of TOX MedFI and PD-1hi frequency in mock-, IL-12/15/18–, and TCR-stimulated (E) CD8+ Tmem and (F) CD8+ Tnaive cells. In A, B, and DF, we calculated indicated statistical significances by (A and D) Wilcoxon’s matched-pairs signed-rank tests, (B) Friedman’s test with Dunn’s multiple comparisons tests, or (E and F) Mann-Whitney U tests. In A and D, each symbol represents a unique time point/treatment connected by donor with bars indicating mean (A, n = 23 across 4 experiments; D, n = 11 across 2 experiments). In E and F, each symbol represents the mean ± SD of the stimulation condition from n = 23 donors across 4 experiments. Representative plots from A, D, and F are sourced from the same donor. TOX, thymocyte selection–associated high-mobility group box; Tmem, memory T cells; Tnaive, naive T cells; PD-1, programmed cell death protein 1; MedFI, median fluorescence intensity; TCR, T cell receptor.
Figure 5
Figure 5. TOX and PD-1 upregulation are largely independent of Tmem subset.
Basal and stimulation-induced TOX and PD-1 expression in CD8+ memory subsets. (A) Representative gating of CD8+ T cells into Tnaive (gray), Tcm (orange), Tem (purple), and Temra (green) subsets. (B) Basal expression levels (MedFI) of TOX and TCF1 and frequency of PD-1hi cells across CD8+ T cell memory subsets. (C) TOX MedFI, PD-1hi frequency, and TCF1 MedFI after mock (black), IL-12/15/18 (each at 100 ng/mL, blue), or TCR (1:1 bead/cell ratio, red) stimulation in CD8+ Tcm (left column), CD8+ Tem (center column), and CD8+ Temra (right column) cells. Symbols in B and C represent unique samples (by time point/condition/subset) and are connected by donor identity, with bars representing mean. We determined statistical significances in B and C, respectively, using Friedman’s tests and Wilcoxon’s matched-pairs signed-rank tests. B and C depict n = 23 donors across 4 experiments, except for TCF1 plots, which depict n = 12 donors across 2 experiments. TOX, thymocyte selection–associated high-mobility group box; Tmem, memory T cells; Tnaive, naive T cells; PD-1, programmed cell death protein 1; MedFI, median fluorescence intensity; Tem, effector memory T cells; TCR, T cell receptor; Temra, CD45RA–expressing effector memory T cells; Tcm, central memory T cells.
Figure 6
Figure 6. Stimulation induces TOX and PD-1 expression in conventional and innate-like T cells.
TOX and PD-1 induction in IAV-specific CD8+ T cells. (A) Gating and memory phenotyping of IAV-specific CD8+ T cells. (B) Induction of TOX and PD-1 in IAV- specific CD8+ T cells by mock (black) or IL-12/15/18 (each at 100 ng/mL, blue) stimulation. (C and D) TOX and PD-1 induction in MAIT cells. (C) Gating and memory phenotyping of MAIT cells. (D) Induction of TOX and PD-1 in MAIT cells by mock (black) or IL-12/15/18 (each at 100 ng/mL, blue) stimulation. Representative plots are sourced from the same donor. Symbols represent unique samples (by time point/condition/subset) and are connected by donor identity, with bars representing mean. We determined statistical significances in B and D using Wilcoxon’s matched-pairs signed-rank tests. A and B depict n = 8 donors across 2 experiments; C and D depict n = 23 donors across 4 experiments. TOX, thymocyte selection–associated high-mobility group box; PD-1, programmed cell death protein 1; IAV, influenza A virus; MAIT, mucosal associated invariant T.
Figure 7
Figure 7. TOX deficiency does not abrogate stimulation-induced PD-1 expression.
(Stimulation-induced PD-1 expression in WT and Tox–/– P14 Tmem cells. T cells were stimulated with media alone (mock), recombinant IL-12, IL-15, and IL-18 in combination (IL-12/15/18 or ILs; each at 100 ng/mL), or with anti-CD3/CD28 microbeads at an approximately 1:1 cell/bead ratio (TCR). (A and B) PD-1 MedFI and expression frequencies in A WT or B Tox–/– P14 Tmem over stimulation time course. (C) Comparison of PD-1 MedFI and expression frequencies between IL-12/15/18 (left) or TCR (right) stimulated WT and Tox–/– P14 Tmem cells. All indicated statistical significances were calculated using Mann-Whitney U tests. Symbols in A and B represent the mean ± SD from all animals at a specific time/condition; and symbols in C represent stimulated P14 Tmem populations within a single animal (n = 9 WT P14 recipients and n = 10 Tox–/– P14 recipient across 2 experiments). TOX, thymocyte selection–associated high-mobility group box; Tmem, memory T cells; PD-1, programmed cell death protein 1; MedFI, median fluorescence intensity; TCR, T cell receptor.

Similar articles

Cited by

References

    1. Zajac AJ, et al. Viral immune evasion due to persistence of activated T cells without effector function. J Exp Med. 1998;188(12):2205–2213. doi: 10.1084/jem.188.12.2205. - DOI - PMC - PubMed
    1. Pauken KE, Wherry EJ. Overcoming T cell exhaustion in infection and cancer. Trends Immunol. 2015;36(4):265–276. doi: 10.1016/j.it.2015.02.008. - DOI - PMC - PubMed
    1. Schietinger A, Greenberg PD. Tolerance and exhaustion: defining mechanisms of T cell dysfunction. Trends Immunol. 2014;35(2):51–60. doi: 10.1016/j.it.2013.10.001. - DOI - PMC - PubMed
    1. Goepfert PA, et al. A significant number of human immunodeficiency virus epitope-specific cytotoxic T lymphocytes detected by tetramer binding do not produce gamma interferon. J Virol. 2000;74(21):10249–10255. doi: 10.1128/JVI.74.21.10249-10255.2000. - DOI - PMC - PubMed
    1. Zehn D, et al. Immune-surveillance through exhausted effector T-cells. Curr Opin Virol. 2016;16:49–54. doi: 10.1016/j.coviro.2016.01.002. - DOI - PubMed

Publication types