

Behavioral fingerprints predict insecticide and anthelmintic mode of action
- PMID: 34031985
- PMCID: PMC8144879
- DOI: 10.15252/msb.202110267
Behavioral fingerprints predict insecticide and anthelmintic mode of action
Abstract
Novel invertebrate-killing compounds are required in agriculture and medicine to overcome resistance to existing treatments. Because insecticides and anthelmintics are discovered in phenotypic screens, a crucial step in the discovery process is determining the mode of action of hits. Visible whole-organism symptoms are combined with molecular and physiological data to determine mode of action. However, manual symptomology is laborious and requires symptoms that are strong enough to see by eye. Here, we use high-throughput imaging and quantitative phenotyping to measure Caenorhabditis elegans behavioral responses to compounds and train a classifier that predicts mode of action with an accuracy of 88% for a set of ten common modes of action. We also classify compounds within each mode of action to discover substructure that is not captured in broad mode-of-action labels. High-throughput imaging and automated phenotyping could therefore accelerate mode-of-action discovery in invertebrate-targeting compound development and help to refine mode-of-action categories.
Keywords: C. elegans; anthelmintics; computational ethology; pesticide; phenotypic screen.
© 2021 The Authors. Published under the terms of the CC BY 4.0 license.
Conflict of interest statement
Research grant support was provided by the Biotechnology and Biological Sciences Research Council of the UK in partnership with Syngenta UK. AJF and PHH are employees of Syngenta UK. AEXB has consulted with Syngenta UK.
Figures
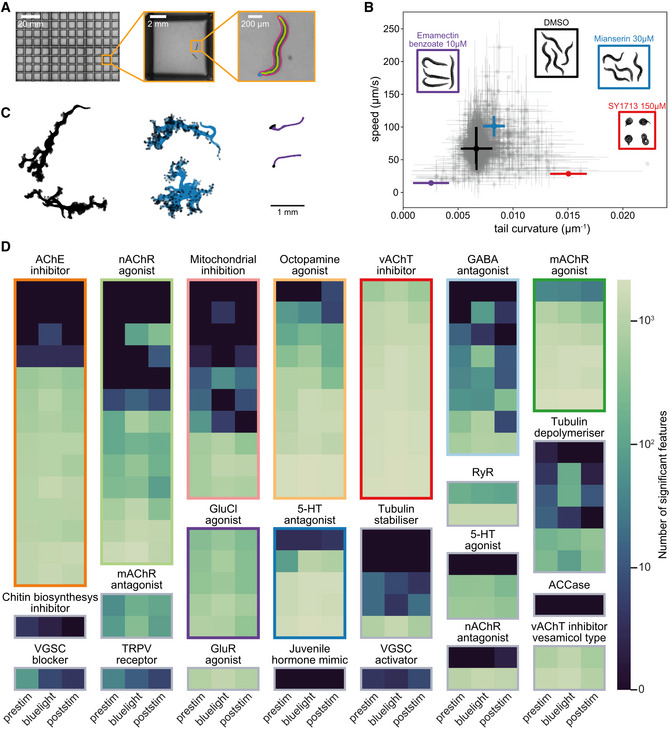
We image an entire 96‐well plate with a megapixel camera array with enough resolution and high enough frame rate to track, segment, and estimate the posture of C. elegans over time.
All compound doses in the speed/tail curvature space, with points and lines showing the mean and standard deviation of biological dose replicates. On average, 12 biological replicates were collected per compound dose, together with 601 DMSO replicates, across at least 3 different tracking days for each condition. Several compounds, including the serotonin receptor antagonist mianserin (blue), glutamate‐gated chloride channel activator emamectin benzoate (purple), and vesicular acetylcholine transporter inhibitor SY1713 (red), have a strong effect on the worms' behavioral phenotype. They can be distinguished from the DMSO control (black) and from each other based on speed and tail curvature alone. Not all compounds are well separated in these two dimensions (gray points). Inset images are samples that show postural differences.
Sample worm skeletons over time show the effect of the compounds highlighted in (B) on motion.
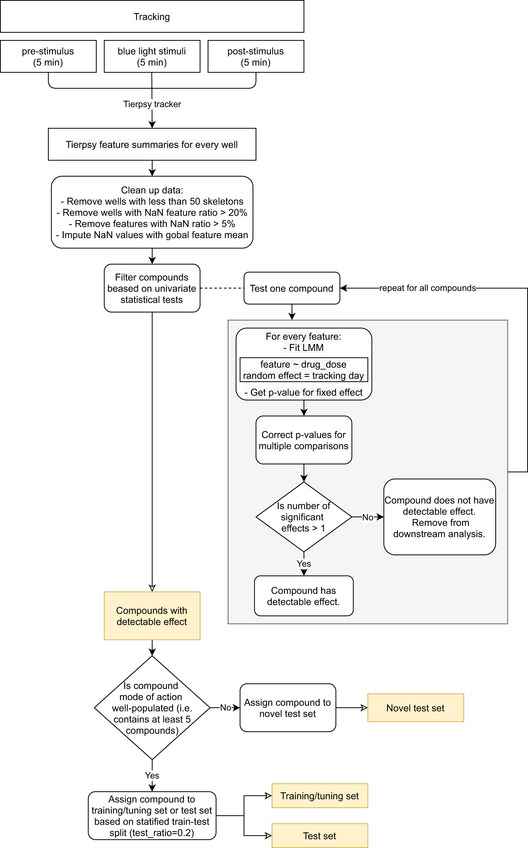
Number of features significantly different from the DMSO control at a false discovery rate of 1% for each compound, grouped by mode of action. The pre‐stimulus, blue light stimulus, and post‐stimulus data are shown separately (a total of 3,020 features are tested for each assay period). The percentage of significantly different features is highest for the blue light stimulus recording.
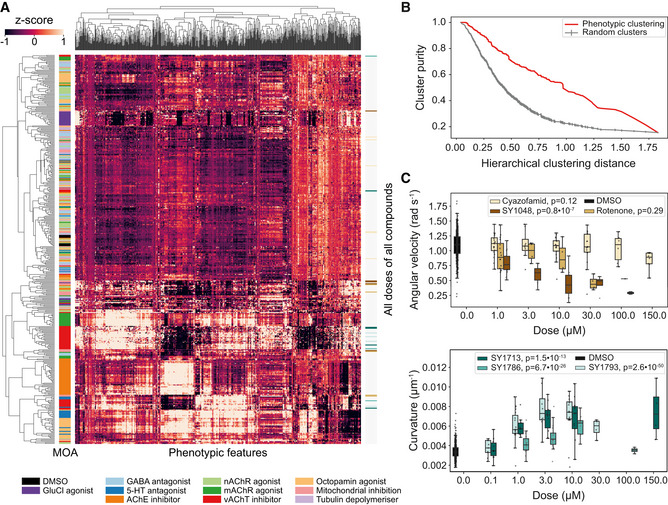
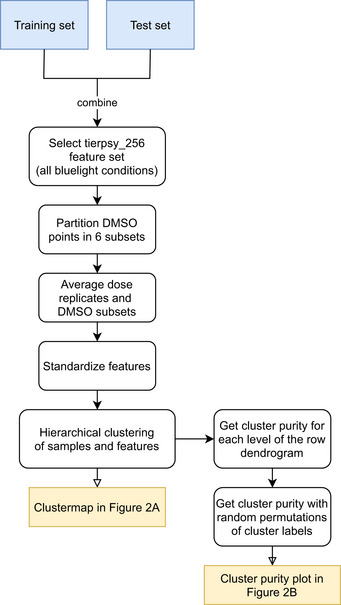
Hierarchical clustering of behavioral fingerprints highlights structure in the responses to different compounds. Each row of the heat map represents the mean dose fingerprint of a specific compound described by 256 pre‐selected features from each blue light condition. Clear clusters can be observed for some compound classes, e.g., AChE inhibitors, vAchT inhibitors, GluCl agonists, and mAchR agonists. Low doses and low potency compounds from different classes cluster together around the DMSO averages at the center‐top part of the heat map.
Cluster purity as a function of the hierarchical cluster distance shows that the degree of mode‐of‐action clustering (red) is greater than expected by chance for random clusters (gray).
Compounds in the same class can have different dose–response curves. (upper) The three mitochondrial inhibitors cyazofamid, rotenone, and SY1048 all decrease angular velocity, but the concentration at which their effect is measurable is not conserved across compounds. (lower) Different spiroindolines affect body curvature differently. SY1786's dose–response curve is non‐monotonic. The central band and box limits show the median and quartiles of the distribution of the biological replicates for each compound dose (on average 12 wells per dose and 601 DMSO wells), while the whiskers extend to 1.5 IQRs beyond the lower and upper quartile. The P‐values reported in the legend represent the significance of the drug dose effect and were estimated using linear mixed models with tracking day as random effect and drug dose as fixed effect. The positions of these compounds in the heat map in (B) are marked using the color bar on the right side of the heat map.
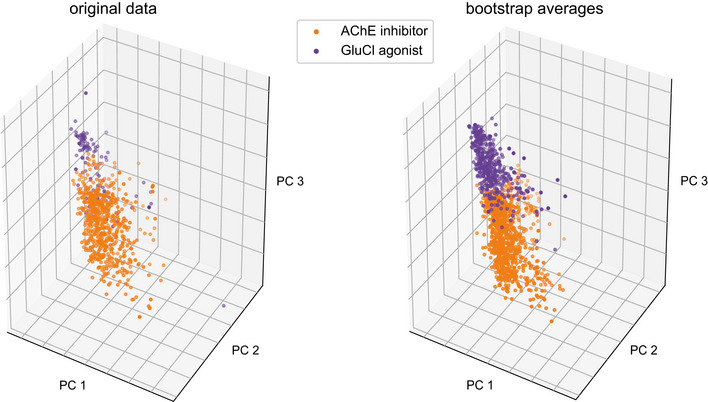
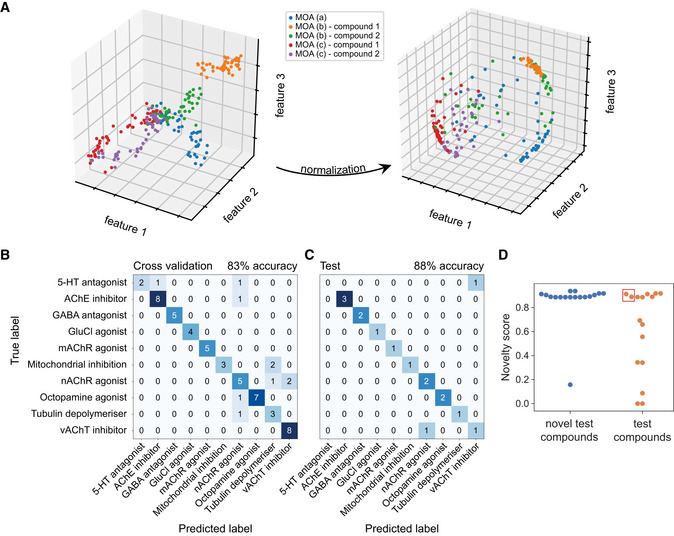
Toy data illustrating the potential benefit of normalization in correcting for potency differences within mode‐of‐action classes. Following normalization, each behavioral fingerprint exists on a hypersphere in the phenotype space regardless of effect size in the original space. Nonlinear dose–response curves will not collapse perfectly following normalization, which is a linear transformation.
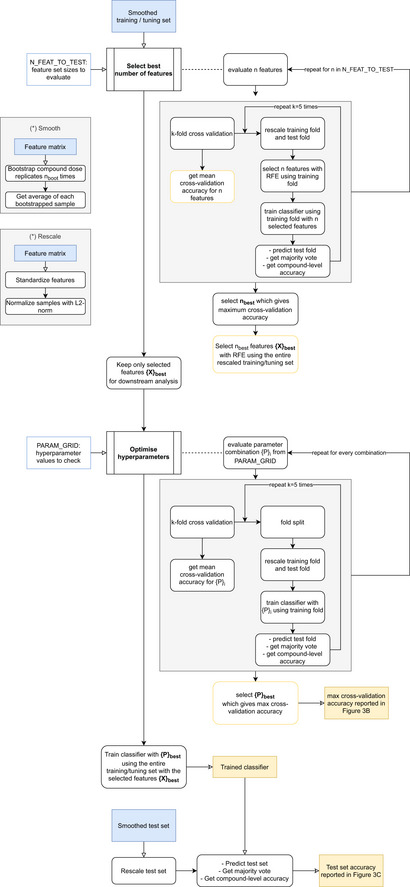
The confusion matrix obtained through cross‐validation for the best performing feature set (1,024 features) and logistic regression classifier following feature selection and hyperparameter tuning on the training data.
The confusion matrix for the classifier trained in (B) applied to previously unseen test compounds without any further tuning.
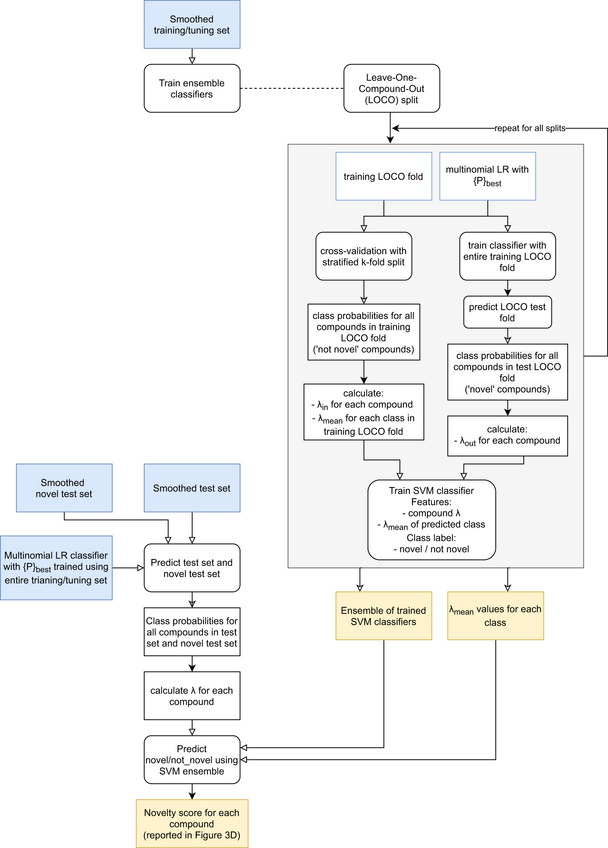
The novelty score assigned to novel test compounds with a mode of action not seen during training compared to the novelty score of compounds from the test set in (C). Novel compounds tend to have higher novelty scores than compounds from previously seen modes of action. The non‐novel compounds with high novelty scores include the two incorrectly classified test compounds (in red box).
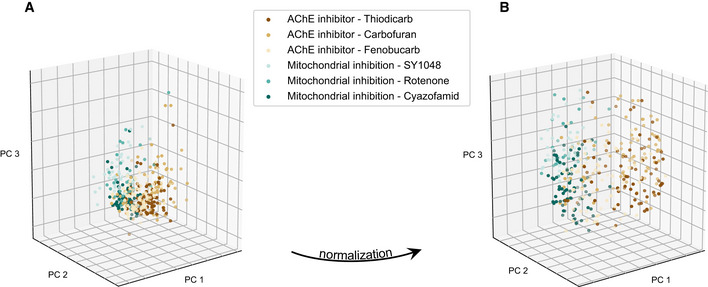
PCA of the data from 2 different classes with 3 compounds each before normalization (data simply standardized).
PCA of the normalized data.
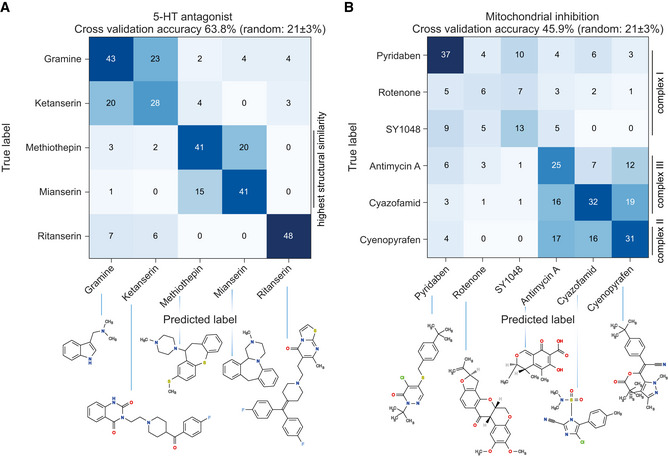
The confusion matrix showing cross‐validation performance of a classifier trained to distinguish serotonin receptor antagonists from each other. Ritanserin is distinguishable from all other compounds, and the two structurally similar antidepressants (mianserin and methiothepin) are somewhat mutually confused by the classifier but are distinguishable from the non‐antidepressants.
The confusion matrix for the mitochondrial inhibitors also shows some substructure: complex II and III inhibitors (cyazofamid, antimycin, cyenopyrafen) are phenotypically similar, and distinct from the complex I inhibitors.
Similar articles
-
An automated high-throughput system for phenotypic screening of chemical libraries on C. elegans and parasitic nematodes.Int J Parasitol Drugs Drug Resist. 2018 Apr;8(1):8-21. doi: 10.1016/j.ijpddr.2017.11.004. Epub 2017 Dec 2. Int J Parasitol Drugs Drug Resist. 2018. PMID: 29223747 Free PMC article.
-
Drug discovery technologies: Caenorhabditis elegans as a model for anthelmintic therapeutics.Med Res Rev. 2020 Sep;40(5):1715-1753. doi: 10.1002/med.21668. Epub 2020 Mar 13. Med Res Rev. 2020. PMID: 32166776 Review.
-
Anthelmintic drugs.WormBook. 2007 Nov 2:1-13. doi: 10.1895/wormbook.1.143.1. WormBook. 2007. PMID: 17988075 Free PMC article. Review.
-
Practical High-Throughput Method to Screen Compounds for Anthelmintic Activity against Caenorhabditis elegans.Molecules. 2021 Jul 8;26(14):4156. doi: 10.3390/molecules26144156. Molecules. 2021. PMID: 34299431 Free PMC article.
-
Identification of compounds with bioactivity against the nematode Caenorhabditis elegans by a screen based on the functional genomics of the marine bacterium Pseudoalteromonas tunicata D2.Appl Environ Microbiol. 2010 Sep;76(17):5710-7. doi: 10.1128/AEM.00695-10. Epub 2010 Jul 2. Appl Environ Microbiol. 2010. PMID: 20601498 Free PMC article.
Cited by
-
Making sense of sensory behaviors in vector-borne helminths.Trends Parasitol. 2022 Oct;38(10):841-853. doi: 10.1016/j.pt.2022.07.003. Epub 2022 Aug 2. Trends Parasitol. 2022. PMID: 35931639 Free PMC article. Review.
-
wrmXpress: A modular package for high-throughput image analysis of parasitic and free-living worms.PLoS Negl Trop Dis. 2022 Nov 18;16(11):e0010937. doi: 10.1371/journal.pntd.0010937. eCollection 2022 Nov. PLoS Negl Trop Dis. 2022. PMID: 36399491 Free PMC article.
-
Image recognition based on deep learning in Haemonchus contortus motility assays.Comput Struct Biotechnol J. 2022 May 13;20:2372-2380. doi: 10.1016/j.csbj.2022.05.014. eCollection 2022. Comput Struct Biotechnol J. 2022. PMID: 35664223 Free PMC article.
-
Phenotypic Profiling of Macrocyclic Lactones on Parasitic Schistosoma Flatworms.Antimicrob Agents Chemother. 2023 Feb 16;67(2):e0123022. doi: 10.1128/aac.01230-22. Epub 2023 Jan 25. Antimicrob Agents Chemother. 2023. PMID: 36695583 Free PMC article.
-
Physics-informed deep learning characterizes morphodynamics of Asian soybean rust disease.Nat Commun. 2021 Nov 5;12(1):6424. doi: 10.1038/s41467-021-26577-1. Nat Commun. 2021. PMID: 34741028 Free PMC article.
References
-
- Anderson DJ, Perona P (2014) Toward a science of computational ethology. Neuron 84: 18–31 - PubMed
-
- Benjamini Y, Yekutieli D (2001) The control of the false discovery rate in multiple testing under dependency. Ann Stat 29: 1165–1188
Publication types
MeSH terms
Substances
Grants and funding
LinkOut - more resources
Full Text Sources
Other Literature Sources
