Observational Study
. 2021 Jun;22(6):781-793.
doi: 10.1038/s41590-021-00933-1. Epub 2021 May 24.

Multimodally profiling memory T cells from a tuberculosis cohort identifies cell state associations with demographics, environment and disease

Affiliations
Observational Study

Multimodally profiling memory T cells from a tuberculosis cohort identifies cell state associations with demographics, environment and disease

Aparna Nathan et al. Nat Immunol. 2021 Jun.

Abstract

Multimodal T cell profiling can enable more precise characterization of elusive cell states underlying disease. Here, we integrated single-cell RNA and surface protein data from 500,089 memory T cells to define 31 cell states from 259 individuals in a Peruvian tuberculosis (TB) progression cohort. At immune steady state >4 years after infection and disease resolution, we found that, after accounting for significant effects of age, sex, season and genetic ancestry on T cell composition, a polyfunctional type 17 helper T (TH17) cell-like effector state was reduced in abundance and function in individuals who previously progressed from Mycobacterium tuberculosis (M.tb) infection to active TB disease. These cells are capable of responding to M.tb peptides. Deconvoluting this state-uniquely identifiable with multimodal analysis-from public data demonstrated that its depletion may precede and persist beyond active disease. Our study demonstrates the power of integrative multimodal single-cell profiling to define cell states relevant to disease and other traits.


Conflict of interest statement

Competing interests

The authors declare no competing interests.

Figures

Extended Data Fig. 1
Extended Data Fig. 1. CITE-seq cell and feature quality
a, In silico memory T cell gating. Each cell is plotted based on its normalized surface expression of CD3 and CD45RO, measured through CITE-seq. Gates are demarcated with red dashed lines. Red cells were removed. Counts represent the number of cells in each quadrant. b, UMAP representation of gated cells. Red cells were gated out in (a) and cells clustering with them in the UMAP (shown in black in (a) and (b)) were also removed. c, Normalized CD3 and CD45RO surface protein expression. d, Number of cells per sample after QC, stratified by TB progression status. P value is from a two-sided t test comparing mean cell counts in each group. e, Pearson correlation coefficient (r) was calculated between normalized mRNA and surface protein expression for each marker across cells passing QC. r is plotted against average normalized mRNA expression for each protein. f, Each cell is plotted based on normalized expression of each marker in surface protein and mRNA, both measured through CITE-seq, with density contours. We fit a best-fit line (in blue) with a linear model.
Extended Data Fig. 2
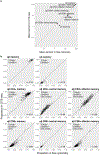
Extended Data Fig. 2. Comparing proportions of eight major T cell states between flow cytometry and CITE-seq
a, Average percents per population in CITE-seq vs. flow cytometry. Gates in (b). Dashed line indicates the identity line. b, For each population, proportions plotted across 259 donors. Flow cytometry gating occurred after gating T cells. CITE-seq gating occurred after isolation of memory T cells. The dashed line indicates the identity line, and we calculated Pearson correlation coefficients (r) for each state.
Extended Data Fig. 3
Extended Data Fig. 3. Multimodal integration with canonical correlation analysis
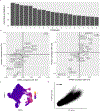
a, Correlations for the top 20 canonical dimensions used in downstream analysis. Bars represent the Pearson correlation between mRNA and protein projections for each dimension. b, Marker correlation with canonical variates (CVs). Each marker is plotted based on its mRNA and protein correlation with CV1 (left) or CV2 (right). c, Innateness scores. UMAP is colored based on a gene expression-derived cytotoxicity score defined in Gutierrez-Arcelus, et al. d, Correlation between innateness score and CV1. Each cell is plotted based on its innateness score from (c) and its CV1 projection, and we report the Pearson correlation coefficient.
Extended Data Fig. 4
Extended Data Fig. 4. Single-cell expression of surface proteins, measured with CITE-seq
Each cell is colored according to its expression of each protein and plotted in UMAP space. Colors are scaled independently for each marker from minimum (blue) to maximum (yellow) expression.
Extended Data Fig. 5
Extended Data Fig. 5. Technical replicate consistency
For each of the 31 clusters, we plotted each multimodal donor based on its proportion in replicate 1 and in replicate 2. We calculated the Pearson correlation coefficients (r) for each cluster.
Extended Data Fig. 6
Extended Data Fig. 6. Effects of donor covariates on memory T cell states
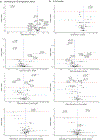
Effects of age, sex, winter blood draw, and proportion of European genetic ancestry in (a) model correcting for technical covariates (# UMIs/cell, % MT UMIs/cell), donor, batch, and TB disease status, and (b) full model with TB disease status, age, sex, winter blood draw, proportion of European genetic ancestry, technical covariates, donor, and batch. For all, n=271 samples from 259 independent donors. For each cluster, data are presented as the MASC OR of a cell being in each cluster given the contrast covariate (95% CI error bars), and the −log(LRT p value) of the association. The dashed horizontal line corresponds to a Bonferroni p-value threshold of 0.05/31. Labeled clusters are significant at this threshold.
Extended Data Fig. 7
Extended Data Fig. 7. Unimodal clusters and associations with TB disease progression
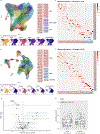
a–c, mRNA clusters. d–f, protein clusters. a and d, UMAPs colored by unimodal clusters. Clusters boxed in red are CD4+, purple are mixed CD4+ and CD8+, blue are CD8+, and green are CD4−CD8−. b and e, Expression of major lineage-defining surface markers measured through CITE-seq. The UMAPs are colored by the expression of five markers measured through CITE-seq. Colors are scaled independently for each marker from minimum (blue) to maximum (yellow) expression. c and f, Heatmap of overlap between mRNA and multimodal clusters. Colors indicate the proportion of the multimodal cluster (column) overlapping with the mRNA cluster (row). g, Associations between TB disease status and unimodal protein clusters. For each cluster, the data are presented as MASC ORs of a cell being in each cluster for cases vs. controls (95% CI error bars), and the −log(LRT p value) of the association (n=271 samples from 259 independent donors). The dashed horizontal line corresponds to a Bonferroni p-value threshold of 0.05/40. Labeled clusters are significant at this threshold. h, Abundance of C-20 in 128 cases and 131 controls. P value is from an LRT with 1 d.f. Boxplots show the median (vertical bar), 25th and 75th percentiles (lower and upper bounds of box, respectively), and 1.5×IQR (or minimum/maximum if they lie within that range; end of whiskers).
Extended Data Fig. 8
Extended Data Fig. 8. Cell state signature extrapolation in public data
a, Correlation between actual and predicted C-12 proportion, per sample in memory T cell CITE-seq study (n = 271, black) and bulk PBMC RNA-seq (n = 15, blue). Line represents the identity line and we calculated the Pearson correlation coefficients (r) for T cell samples and bulk PBMC samples separately. Predicted (b) C-12 or (c) C-11 (Th2, negative control) proportion in 3 categories of donors from Berry, et al. d, Predicted C-12 proportion in active donors at 3 time points during anti-mycobacterial treatment (0, 2, 12 months) and uninfected controls. In b–d, we calculated p-values with a two-sided t test. e, Histogram of two-sided t test p values from 1,000 trials of downsampling LIMAA cohort to 7 cases and 12 controls (as in Berry, et al.) and comparing the average C-12 proportion in cases vs controls. Dashed line is the significance threshold of p = 0.05 (power = 0.15). f, Predicted C-12 proportion in active cases and latent controls at 2 pre-disease-progression time points in Scriba, et al. g, Predicted C-12 proportion in active cases and latent controls in pre- and post-disease cohorts. Pre-disease data are aggregated across 2 time points. In f and g, p-values are from a one-sided t-test (Satterthwaite’s d.f. method) of the beta estimate for TB progression status in the linear mixed model. h, Concordance of Pearson correlations between each cluster’s proportion and the C-12 score or the C-12 cluster’s proportion. Pearson correlation coefficients were computed for each cluster across 271 memory T cell samples. Each point represents one of the 31 clusters, and the dashed line is the identity line. All boxplots show the median (vertical bar), 25th and 75th percentiles (lower and upper bounds of box, respectively), and 1.5xIQR (or minimum/maximum if they lie within that range; end of whiskers).
Extended Data Fig. 9
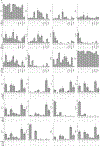
Extended Data Fig. 9. Cytokine production in Boston donors
Bars represent the mean and error bars show standard error of the mean across 5 Boston donors unascertained for TB. a, Per-donor percent of cells producing each cytokine in gated populations. b, Per-donor percent of total cytokine-producing memory CD4+ T cells in each gated population.
Extended Data Fig. 10
Extended Data Fig. 10. M.tb antigen-specific response in CD4+CD26+CD161+CCR6+ memory T cells
a, Biaxial plots showing representative gating of CD3+CD4+CD45RO+CD161+CCR6+CD26+ cells in a Boston donor. b, Intracellular staining for IL-17A and IFNγ in a Boston control donor and two Peruvian TB cohort donors after either no peptide stimulation (control) or stimulation with the MTB300 megapool. c, IL-17A or IFNγ response to MTB300 stimulation in all CD3+ T cells from either Boston control donors (n = 2) or Peruvian TB cohort donors (n = 6). Each point corresponds to the percent of cells producing IL-17A or IFNγ from one donor, measured with intracellular cytokine staining. Lines connect measurements from the same donor before and after stimulation with MTB300 peptide megapool. Boxplots show the median (vertical bar), 25th and 75th percentiles (lower and upper bounds of box, respectively), and minimum/maximum (end of whiskers). P values are from a two-sided Wilcoxon signed-rank test comparing donors before and after antigen stimulation.
Figure 1.
Figure 1.. Study design and quality control.
a, We obtained PBMCs from a Peruvian TB cohort (n=264 donors and 12 technical replicates, over 46 independent experiments), profiled memory T cells with CITE-seq, and integrated multimodal single-cell profiles to define cell states and case-control differences. b, Cell counts over six quality control steps. c, Single-cell quality metrics. Each cell is plotted according to the proportion of MT UMIs and the number of genes expressed. QC thresholds are demarcated with dashed lines. Counts indicate the number of cells in each quadrant. d, Distribution of post-QC cell yields for 259 samples. e, Schematic of canonical correlation analysis.
Figure 2.
Figure 2.. Landscape of memory T cell states.
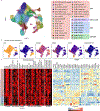
a, UMAP colored by 31 multimodal clusters. Cluster annotations are based on top differentially expressed genes and surface proteins. Clusters boxed in red are CD4+, purple are mixed CD4+ and CD8+, blue are CD8+, and green are CD4−CD8−. b, Expression of major lineage-defining surface proteins measured through CITE-seq. Colors are scaled independently for each marker from minimum (blue) to maximum (yellow) expression. c, Heatmap of selected marker genes. Surface protein heatmap colors are uniformly scaled for each protein. mRNA heatmap colors reflect z-scores for each gene.
Figure 3.
Figure 3.. Memory T cell state associations with demographic and environmental factors.
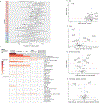
a, Distribution of cluster proportions across donors (n = 259). Boxplots show the median (vertical bar), 25th and 75th percentiles (lower and upper bounds of box, respectively), and 1.5xinterquartile range (IQR) (or minimum/maximum if they lie within that range; end of whiskers). Only non-zero proportions are plotted. b–e, Effects of age, sex, winter blood draw, and proportion of European genetic ancestry in univariate model correcting for technical covariates (# UMIs/cell, % MT UMIs/cell), donor, and batch. Error bars show the 95% confidence interval. f, Associations of covariates with T cell composition. Each column represents associations from a MASC model fit with the indicated covariate (row) as the contrast, and correcting for the indicated covariates (cumulative column headings, from left) as fixed effects and donor and batch as random effects. Heatmap colors correspond to gamma test p-values, white indicates that the covariate is not significant after multiple testing correction (p>.05/38), and gray indicates that the covariate has already been added to the model. Age and age are linear and quadratic terms of age at blood draw. Technical effects are # UMIs/cell and % MT UMIs/cell. IPT = isoniazid preventative therapy. BMI = body mass index. SES = socioeconomic status. BCG = Bacillus Calmette-Guérin. For all, n=271 samples from 259 independent donors.
Figure 4.
Figure 4.. Identification and isolation of a depleted memory T cell state in TB cases.
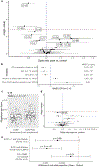
a, Associations between TB disease status and memory T cell states. Data are presented as the MASC odds ratio (OR) of a cell being in each multimodal cluster for cases vs. controls (95% confidence interval [CI] error bars), and the −log(LRT p-value) of the association. The dashed horizontal line corresponds to a Bonferroni p-value threshold of 0.05/31. Labeled clusters are significant at a nominal threshold of p<0.05. b, C-12’s association with each covariate in the full model. Data are presented as the MASC OR of a cell being in C-12 based on each covariate (95% CI error bars). P values are from an LRT with 1 degree of freedom (d.f.) c, Abundance of C-12 in 128 cases and 131 controls. Boxplots show the median (horizontal bar), 25th and 75th percentiles (lower and upper bounds of box, respectively), and 1.5xIQR (or minimum/maximum if they lie within that range; end of whiskers). P values are from an LRT with 1 d.f. d, Associations between TB disease status and unimodal mRNA clusters. Data are presented as the MASC OR of a cell being in that cluster for cases vs. controls (95% CI error bars), and the −log(LRT p value) of the association. The dashed horizontal line corresponds to a Bonferroni p value threshold of 0.05/37. e, Difference in C-12 or C-11 proportion (case-control) in pre- or post-disease cohorts, estimated by linear mixed model correcting for age, sex, sequencing technology, and donor. Pre-disease data are aggregated across 2 time points (n=98 samples from 54 independent donors. Data are presented as the beta estimate for TB progression status in each data set/cell state (95% confidence interval error bars) and corresponding p values from a one-sided t-test (Satterthwaite’s d.f. method). For LIMAA (a-e), n=271 samples from 259 independent donors.
Figure 5.
Figure 5.. Identifying sortable markers of C-12 for ex vivo isolation.
a, Surface protein markers of C-12. Colors are scaled independently for each marker from minimum (blue) to maximum (yellow) expression. b, Classification tree to gate C-12 in CITE-seq data. Each level of the tree represents an additional gate. True positives (TP) are cells in C-12 that are in the gate. False positives (FP) are cells not in C-12 that are in the gate. True negatives (TN) are cells not in C-12 that are not in the gate. False negatives are cells in C-12 that are not in the gate. Sensitivity =TP/(TP + FN). Specificity = TN/(TN + FP). c, Comparison of C-12 and gated population in UMAP space. d, Distribution of each gate across clusters. e, Association of gated populations with TB progression status. For each gated population, data are presented as the MASC OR of a cell having that phenotype for cases vs. controls (95% CI error bars; n=271 samples from 259 independent donors). P values are from an LRT with 1 d.f.
Figure 6.
Figure 6.. Defining C-12’s cytokine profile in a Boston donor.
a, Cytokine expression in supernatant for four CD4+ T cell subsets after CD3/CD28 bead stimulation. We estimated cytokine concentrations and averaged across donors (n = 3), scaled by cytokine, and binned into sextiles. b, Cytokine expression in gated population based on ICS (n = 5). Data are presented as Cochran-Mantel-Haenszel ORs of cytokine production inside vs. outside the gate (95% CI error bars). c, Gating strategy to isolate CD26+CD161+CCR6+ memory CD4+ T cells. Intracellular staining for IL-17A and IL-22 is shown without stimulation and d, after stimulation with PMA/ionomycin. e–g, Per-donor percent of cells producing (e) IL-17A, (f) IL-22, and (g) IFNγ in gated populations. Bars represent the mean and error bars show standard error of the mean across 5 Boston donors unascertained for TB.
Figure 7.
Figure 7.. Characterizing C-12 as an IL-17+ state with reduced function in Peruvian TB cases.
a, Correlation between abundance of flow-gated population (CD4+CD45RO+CD26+CD161+CCR6+) and C-12, per donor. b, Correlation between abundance of flow-gated population (CD4+CD45RO+CD26+CD161+CCR6+) and in silico-gated population, per donor. In, (a) and (b), we calculated a linear best fit line and Pearson correlation coefficient (r) across 16 donors. c, Per-donor percent of cells producing IL-17A (left) and IL-22 (right) in populations gated in Peruvian TB cohort donors. d, Percent of IL-17A (left) or IL-22 (right)-producing cells in gated populations. In (c) and (d), bars represent the mean and error bars show standard error of the mean across 16 donors. e, IL-17A or IL-22 production in gated populations. Data are presented as Cochran-Mantel-Haenszel ORs of cytokine production inside vs. outside the gate (95% CI error bars; n=16 independent samples). f, Case-control comparison of per-donor percent of cells in indicated gates producing IL-17A (top) or IL- 22 (bottom). Paired samples were matched for age, sex, season of blood draw, and proportion of European ancestry. P values are from a one-sided Wilcoxon signed-rank test. g, M.tb-specific IL-17A or IFNγ response to MTB300 stimulation in CD4+ CD26+CD161+CCR6+ memory T cells from either Boston control donors (n = 2) or Peruvian TB cohort donors (n = 6). Each point corresponds to the percent of cells producing IL-17A or IFNγ from one donor, measured with intracellular cytokine staining. Lines connect measurements from the same donor before and after stimulation with MTB300 peptide megapool. P values are from a two-sided Wilcoxon signed-rank test comparing donors before and after antigen stimulation. In (f) and (g), Boxplots show the median (vertical bar), 25th and 75th percentiles (lower and upper bounds of box, respectively), and 1.5×IQR (or minimum/maximum if they lie within that range; end of whiskers).

Comment in

  • Mitigating myopia in tuberculosis.
    Dunstan SJ, Hawn TR. Dunstan SJ, et al. Nat Immunol. 2021 Jun;22(6):675-676. doi: 10.1038/s41590-021-00935-z. Nat Immunol. 2021. PMID: 34031615 No abstract available.

Similar articles

Cited by

References

    1. Nathan A, Baglaenko Y, Fonseka CY, Beynor JI & Raychaudhuri S Multimodal single-cell approaches shed light on T cell heterogeneity. Curr Opin Immunol 61, 17–25, doi:10.1016/j.coi.2019.07.002 (2019). - DOI - PMC - PubMed
    1. Spitzer MH & Nolan GP Mass Cytometry: Single Cells, Many Features. Cell 165, 780–791, doi:10.1016/j.cell.2016.04.019 (2016). - DOI - PMC - PubMed
    1. Peterson VM et al. Multiplexed quantification of proteins and transcripts in single cells. Nat Biotechnol 35, 936–939, doi:10.1038/nbt.3973 (2017). - DOI - PubMed
    1. Stoeckius M et al. Simultaneous epitope and transcriptome measurement in single cells. Nat Methods 14, 865–868, doi:10.1038/nmeth.4380 (2017). - DOI - PMC - PubMed
    1. Carr EJ et al. The Cellular Composition of the Human Immune System Is Shaped by Age and Cohabitation. Nat Immunol 17, 461–468, doi:10.1038/ni.3371 (2016). - DOI - PMC - PubMed

Publication types

MeSH terms