Hypoxia Supports Differentiation of Terminally Exhausted CD8 T Cells
- PMID: 34025660
- PMCID: PMC8137905
- DOI: 10.3389/fimmu.2021.660944
Hypoxia Supports Differentiation of Terminally Exhausted CD8 T Cells
Abstract
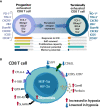
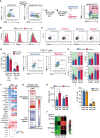
Hypoxia, angiogenesis, and immunosuppression have been proposed to be interrelated events that fuel tumor progression and impair the clinical effectiveness of anti-tumor therapies. Here we present new mechanistic data highlighting the role of hypoxia in fine-tuning CD8 T cell exhaustion in vitro, in an attempt to reconcile seemingly opposite evidence regarding the impact of hypoxia on functional features of exhausted CD8 T cells. Focusing on the recently characterized terminally-differentiated and progenitor exhausted CD8 T cells, we found that both hypoxia and its regulated mediator, vascular endothelial growth factor (VEGF)-A, promote the differentiation of PD-1+ TIM-3+ CXCR5+ terminally exhausted-like CD8 T cells at the expense of PD-1+ TIM-3- progenitor-like subsets without affecting tumor necrosis factor (TNF)-α and interferon (IFN)-γ production or granzyme B (GZMB) expression by these subpopulations. Interestingly, hypoxia accentuated the proangiogenic secretory profile in exhausted CD8 T cells. VEGF-A was the main factor differentially secreted by exhausted CD8 T cells under hypoxic conditions. In this sense, we found that VEGF-A contributes to generation of terminally exhausted CD8 T cells during in vitro differentiation. Altogether, our findings highlight the reciprocal regulation between hypoxia, angiogenesis, and immunosuppression, providing a rational basis to optimize synergistic combinations of antiangiogenic and immunotherapeutic strategies, with the overarching goal of improving the efficacy of these treatments.
Keywords: CD8 T cell exhaustion; Hypoxia; VEGF-A; anti cancer agents; immunosuppression.
Copyright © 2021 Bannoud, Dalotto-Moreno, Kindgard, García, Blidner, Mariño, Rabinovich and Croci.
Conflict of interest statement
The authors declare that the research was conducted in the absence of any commercial or financial relationships that could be construed as a potential conflict of interest.
Figures


Similar articles
-
CXCR5 and TIM-3 expressions define distinct exhausted T cell subsets in experimental cutaneous infection with Leishmania mexicana.Front Immunol. 2023 Aug 25;14:1231836. doi: 10.3389/fimmu.2023.1231836. eCollection 2023. Front Immunol. 2023. PMID: 37691941 Free PMC article.
-
Anti-VEGF Treatment Enhances CD8+ T-cell Antitumor Activity by Amplifying Hypoxia.Cancer Immunol Res. 2020 Jun;8(6):806-818. doi: 10.1158/2326-6066.CIR-19-0360. Epub 2020 Apr 1. Cancer Immunol Res. 2020. PMID: 32238381
-
PTPN2 regulates the generation of exhausted CD8+ T cell subpopulations and restrains tumor immunity.Nat Immunol. 2019 Oct;20(10):1335-1347. doi: 10.1038/s41590-019-0480-4. Epub 2019 Sep 16. Nat Immunol. 2019. PMID: 31527834 Free PMC article.
-
Exhausted CD8+T Cells in the Tumor Immune Microenvironment: New Pathways to Therapy.Front Immunol. 2021 Feb 2;11:622509. doi: 10.3389/fimmu.2020.622509. eCollection 2020. Front Immunol. 2021. PMID: 33633741 Free PMC article. Review.
-
Exhausted CD8+ T cells face a developmental fork in the road.Trends Immunol. 2023 Apr;44(4):276-286. doi: 10.1016/j.it.2023.02.006. Epub 2023 Mar 11. Trends Immunol. 2023. PMID: 36907685 Free PMC article. Review.
Cited by
-
Hypoxia and hypoxia-inducible factor signals regulate the development, metabolism, and function of B cells.Front Immunol. 2022 Aug 15;13:967576. doi: 10.3389/fimmu.2022.967576. eCollection 2022. Front Immunol. 2022. PMID: 36045669 Free PMC article. Review.
-
Tumor immune microenvironment and systemic response in breast cancer.Med Oncol. 2022 Sep 29;39(12):208. doi: 10.1007/s12032-022-01782-0. Med Oncol. 2022. PMID: 36175677 Review.
-
Transcriptional rewiring in CD8+ T cells: implications for CAR-T cell therapy against solid tumours.Front Immunol. 2024 Sep 27;15:1412731. doi: 10.3389/fimmu.2024.1412731. eCollection 2024. Front Immunol. 2024. PMID: 39399500 Free PMC article. Review.
-
Hypoxia-inducible factors: cancer progression and clinical translation.J Clin Invest. 2022 Jun 1;132(11):e159839. doi: 10.1172/JCI159839. J Clin Invest. 2022. PMID: 35642641 Free PMC article. Review.
-
CD8 + T cell infiltration is associated with improved survival and negatively correlates with hypoxia in clear cell ovarian cancer.Sci Rep. 2023 Apr 21;13(1):6530. doi: 10.1038/s41598-023-30655-3. Sci Rep. 2023. PMID: 37085560 Free PMC article.
References
Publication types
MeSH terms
Substances
Grants and funding
LinkOut - more resources
Full Text Sources
Other Literature Sources
Research Materials

