

TIGIT and PD-1 Immune Checkpoint Pathways Are Associated With Patient Outcome and Anti-Tumor Immunity in Glioblastoma
- PMID: 34025646
- PMCID: PMC8137816
- DOI: 10.3389/fimmu.2021.637146
TIGIT and PD-1 Immune Checkpoint Pathways Are Associated With Patient Outcome and Anti-Tumor Immunity in Glioblastoma
Abstract
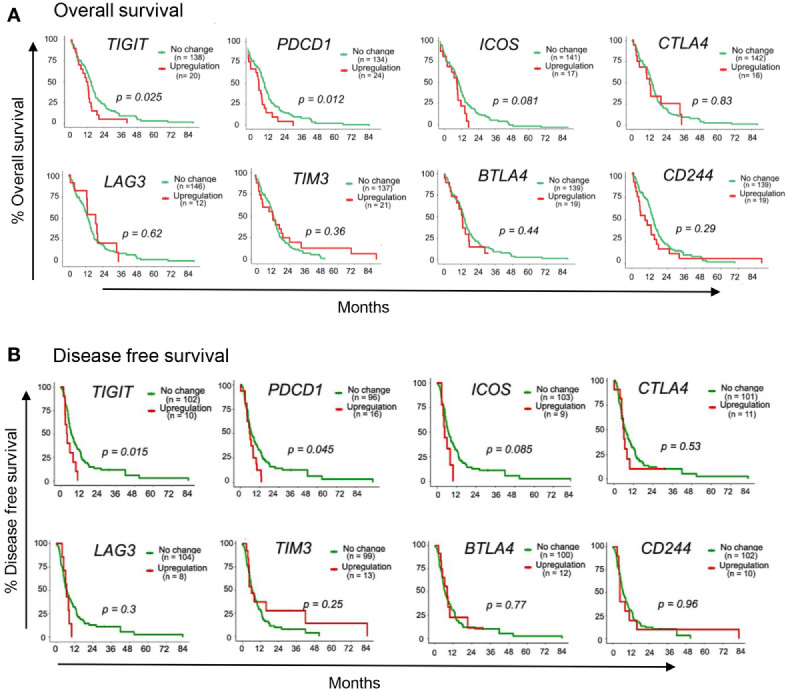
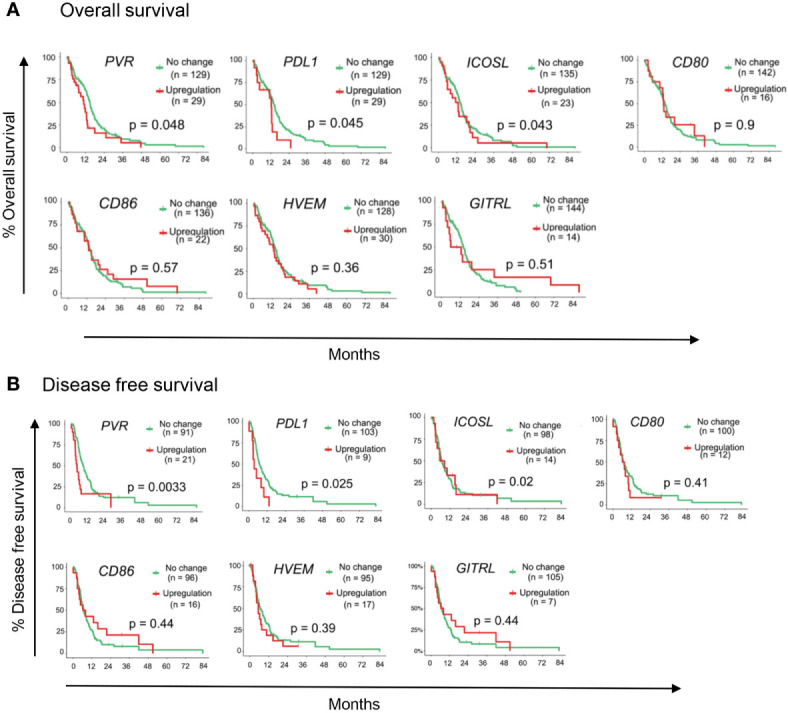
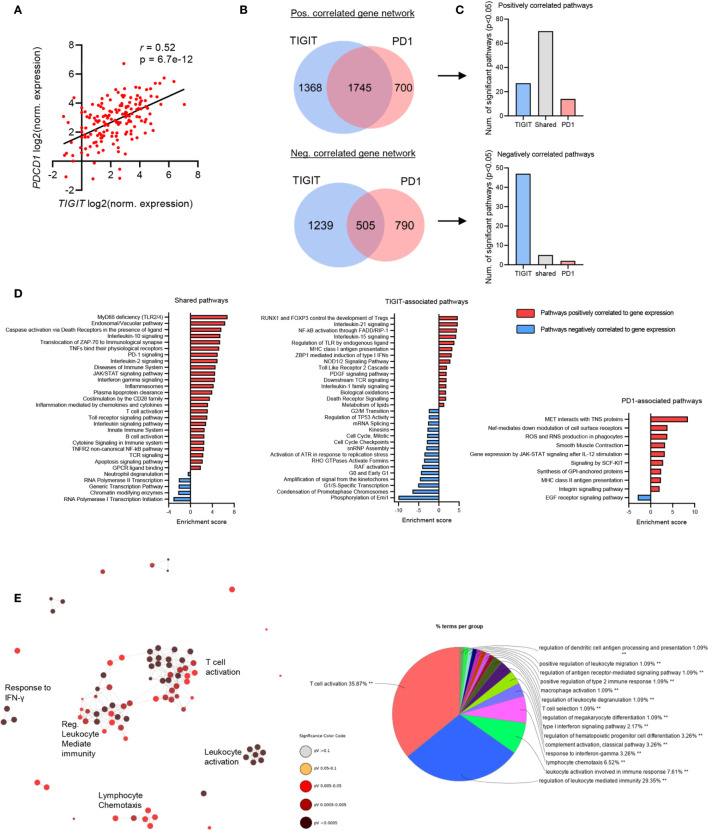
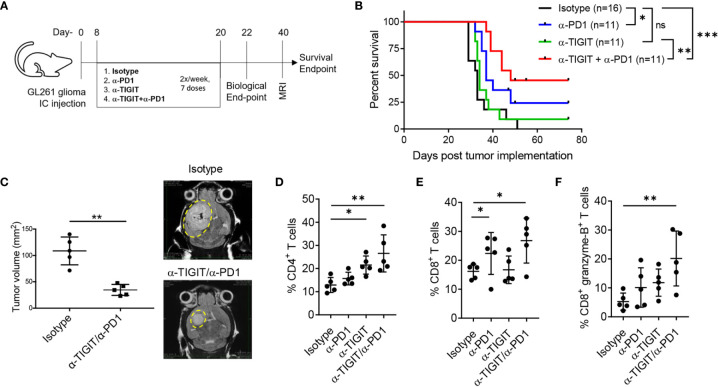
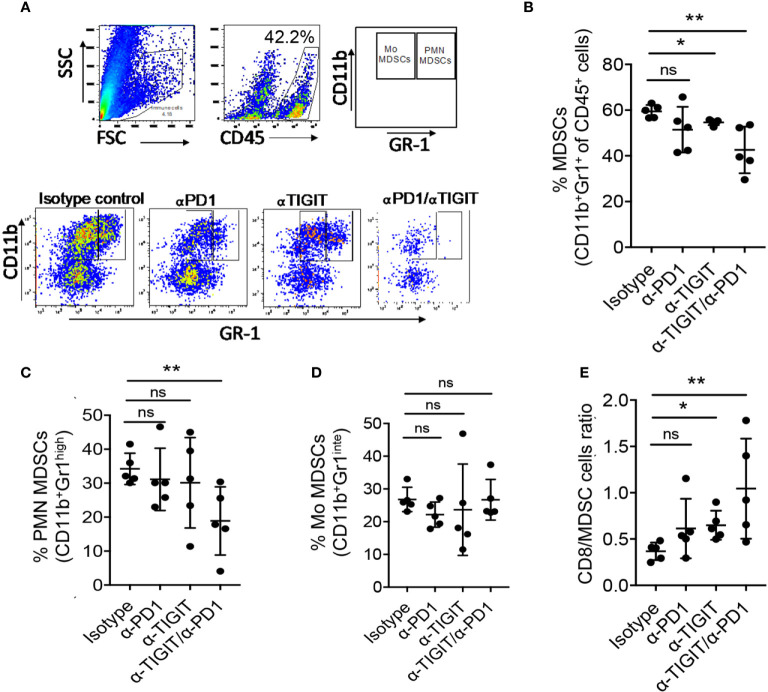
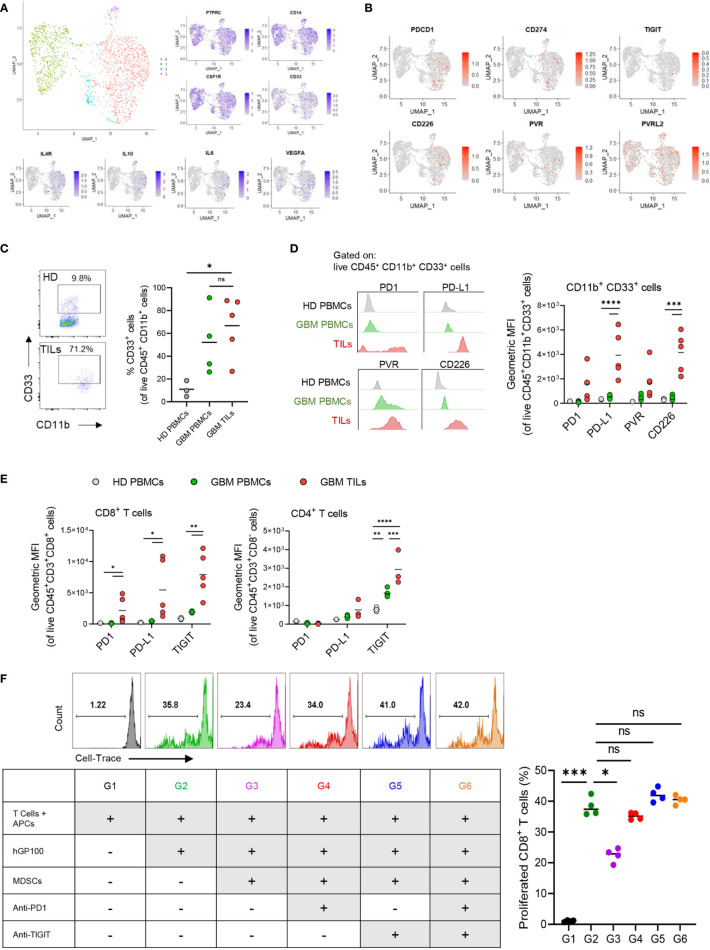
Glioblastoma (GBM) remains an aggressive brain tumor with a high rate of mortality. Immune checkpoint (IC) molecules are expressed on tumor infiltrating lymphocytes (TILs) and promote T cell exhaustion upon binding to IC ligands expressed by the tumor cells. Interfering with IC pathways with immunotherapy has promoted reactivation of anti-tumor immunity and led to success in several malignancies. However, IC inhibitors have achieved limited success in GBM patients, suggesting that other checkpoint molecules may be involved with suppressing TIL responses. Numerous IC pathways have been described, with current testing of inhibitors underway in multiple clinical trials. Identification of the most promising checkpoint pathways may be useful to guide the future trials for GBM. Here, we analyzed the The Cancer Genome Atlas (TCGA) transcriptomic database and identified PD1 and TIGIT as top putative targets for GBM immunotherapy. Additionally, dual blockade of PD1 and TIGIT improved survival and augmented CD8+ TIL accumulation and functions in a murine GBM model compared with either single agent alone. Furthermore, we demonstrated that this combination immunotherapy affected granulocytic/polymorphonuclear (PMN) myeloid derived suppressor cells (MDSCs) but not monocytic (Mo) MDSCs in in our murine gliomas. Importantly, we showed that suppressive myeloid cells express PD1, PD-L1, and TIGIT-ligands in human GBM tissue, and demonstrated that antigen specific T cell proliferation that is inhibited by immunosuppressive myeloid cells can be restored by TIGIT/PD1 blockade. Our data provide new insights into mechanisms of GBM αPD1/αTIGIT immunotherapy.
Keywords: MDSCs; PD1; TIGIT; gene network analyses; glioblastoma; immunotherapy; myeloid suppressor cell.
Copyright © 2021 Raphael, Kumar, McCarl, Shoger, Wang, Sandlesh, Sneiderman, Allen, Zhai, Campagna, Foster, Bruno, Agnihotri, Hu, Castro, Lieberman, Broniscer, Diaz, Amankulor, Rajasundaram, Pollack and Kohanbash.
Conflict of interest statement
The authors declare that the research was conducted in the absence of any commercial or financial relationships that could be construed as a potential conflict of interest.
Figures
Similar articles
-
TOX-expressing terminally exhausted tumor-infiltrating CD8+ T cells are reinvigorated by co-blockade of PD-1 and TIGIT in bladder cancer.Cancer Lett. 2021 Feb 28;499:137-147. doi: 10.1016/j.canlet.2020.11.035. Epub 2020 Nov 27. Cancer Lett. 2021. PMID: 33249194
-
TIGIT and PD1 Co-blockade Restores ex vivo Functions of Human Tumor-Infiltrating CD8+ T Cells in Hepatocellular Carcinoma.Cell Mol Gastroenterol Hepatol. 2021;12(2):443-464. doi: 10.1016/j.jcmgh.2021.03.003. Epub 2021 Mar 27. Cell Mol Gastroenterol Hepatol. 2021. PMID: 33781741 Free PMC article.
-
CCR2 inhibition reduces tumor myeloid cells and unmasks a checkpoint inhibitor effect to slow progression of resistant murine gliomas.Proc Natl Acad Sci U S A. 2020 Jan 14;117(2):1129-1138. doi: 10.1073/pnas.1910856117. Epub 2019 Dec 26. Proc Natl Acad Sci U S A. 2020. PMID: 31879345 Free PMC article.
-
Current progress of anti‑PD‑1/PDL1 immunotherapy for glioblastoma (Review).Mol Med Rep. 2024 Dec;30(6):221. doi: 10.3892/mmr.2024.13344. Epub 2024 Oct 4. Mol Med Rep. 2024. PMID: 39364736 Free PMC article. Review.
-
Targeting the PD-1/PD-L1 pathway in glioblastoma multiforme: Preclinical evidence and clinical interventions.Int Immunopharmacol. 2021 Apr;93:107403. doi: 10.1016/j.intimp.2021.107403. Epub 2021 Feb 12. Int Immunopharmacol. 2021. PMID: 33581502 Review.
Cited by
-
Immune checkpoint pathways in glioblastoma: a diverse and evolving landscape.Front Immunol. 2024 Sep 13;15:1424396. doi: 10.3389/fimmu.2024.1424396. eCollection 2024. Front Immunol. 2024. PMID: 39346924 Free PMC article. Review.
-
Long Non-Coding RNAs as Epigenetic Regulators of Immune Checkpoints in Cancer Immunity.Cancers (Basel). 2022 Dec 28;15(1):184. doi: 10.3390/cancers15010184. Cancers (Basel). 2022. PMID: 36612180 Free PMC article. Review.
-
Blocking TIGIT/CD155 signalling reverses CD8+ T cell exhaustion and enhances the antitumor activity in cervical cancer.J Transl Med. 2022 Jun 21;20(1):280. doi: 10.1186/s12967-022-03480-x. J Transl Med. 2022. PMID: 35729552 Free PMC article.
-
Mannose-modified erythrocyte membrane-encapsulated chitovanic nanoparticles as a DNA vaccine carrier against reticuloendothelial tissue hyperplasia virus.Front Immunol. 2023 Jan 4;13:1066268. doi: 10.3389/fimmu.2022.1066268. eCollection 2022. Front Immunol. 2023. PMID: 36776397 Free PMC article.
-
Nanomaterials: small particles show huge possibilities for cancer immunotherapy.J Nanobiotechnology. 2022 Nov 16;20(1):484. doi: 10.1186/s12951-022-01692-3. J Nanobiotechnology. 2022. PMID: 36384524 Free PMC article. Review.
References
Publication types
MeSH terms
Substances
Grants and funding
LinkOut - more resources
Full Text Sources
Other Literature Sources
Medical
Research Materials