Environmental Enrichment Induces Epigenomic and Genome Organization Changes Relevant for Cognition
- PMID: 34025350
- PMCID: PMC8131874
- DOI: 10.3389/fnmol.2021.664912
Environmental Enrichment Induces Epigenomic and Genome Organization Changes Relevant for Cognition
Abstract
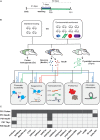
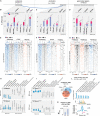
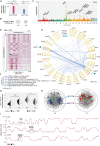
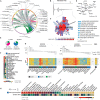
In early development, the environment triggers mnemonic epigenomic programs resulting in memory and learning experiences to confer cognitive phenotypes into adulthood. To uncover how environmental stimulation impacts the epigenome and genome organization, we used the paradigm of environmental enrichment (EE) in young mice constantly receiving novel stimulation. We profiled epigenome and chromatin architecture in whole cortex and sorted neurons by deep-sequencing techniques. Specifically, we studied chromatin accessibility, gene and protein regulation, and 3D genome conformation, combined with predicted enhancer and chromatin interactions. We identified increased chromatin accessibility, transcription factor binding including CTCF-mediated insulation, differential occupancy of H3K36me3 and H3K79me2, and changes in transcriptional programs required for neuronal development. EE stimuli led to local genome re-organization by inducing increased contacts between chromosomes 7 and 17 (inter-chromosomal). Our findings support the notion that EE-induced learning and memory processes are directly associated with the epigenome and genome organization.
Keywords: 3D genome organization; Hi-C; chromatin accessibility; environmental enrichment; epigenetics; inter-chromosomal contacts; learning; postnatal development.
Copyright © 2021 Espeso-Gil, Holik, Bonnin, Jhanwar, Chandrasekaran, Pique-Regi, Albaigès-Ràfols, Maher, Permanyer, Irimia, Friedländer, Pons-Espinal, Akbarian, Dierssen, Maass, Hor and Ossowski.
Conflict of interest statement
The authors declare that the research was conducted in the absence of any commercial or financial relationships that could be construed as a potential conflict of interest.
Figures


Similar articles
-
3D Genome Plasticity in Normal and Diseased Neurodevelopment.Genes (Basel). 2022 Nov 1;13(11):1999. doi: 10.3390/genes13111999. Genes (Basel). 2022. PMID: 36360237 Free PMC article. Review.
-
Impact of 3D genome organization, guided by cohesin and CTCF looping, on sex-biased chromatin interactions and gene expression in mouse liver.Epigenetics Chromatin. 2020 Jul 17;13(1):30. doi: 10.1186/s13072-020-00350-y. Epigenetics Chromatin. 2020. PMID: 32680543 Free PMC article.
-
Late-Life Environmental Enrichment Induces Acetylation Events and Nuclear Factor κB-Dependent Regulations in the Hippocampus of Aged Rats Showing Improved Plasticity and Learning.J Neurosci. 2016 Apr 13;36(15):4351-61. doi: 10.1523/JNEUROSCI.3239-15.2016. J Neurosci. 2016. PMID: 27076430 Free PMC article.
-
High-Resolution Mapping of Chromatin Conformation in Cardiac Myocytes Reveals Structural Remodeling of the Epigenome in Heart Failure.Circulation. 2017 Oct 24;136(17):1613-1625. doi: 10.1161/CIRCULATIONAHA.117.029430. Epub 2017 Aug 11. Circulation. 2017. PMID: 28802249 Free PMC article.
-
Understanding 3D Genome Organization and Its Effect on Transcriptional Gene Regulation Under Environmental Stress in Plant: A Chromatin Perspective.Front Cell Dev Biol. 2021 Dec 8;9:774719. doi: 10.3389/fcell.2021.774719. eCollection 2021. Front Cell Dev Biol. 2021. PMID: 34957106 Free PMC article. Review.
Cited by
-
Neurodynamical Computing at the Information Boundaries of Intelligent Systems.Cognit Comput. 2024;16(5):1-13. doi: 10.1007/s12559-022-10081-9. Epub 2022 Dec 27. Cognit Comput. 2024. PMID: 39129840 Free PMC article.
-
SATB2 organizes the 3D genome architecture of cognition in cortical neurons.Mol Cell. 2024 Feb 15;84(4):621-639.e9. doi: 10.1016/j.molcel.2023.12.024. Epub 2024 Jan 19. Mol Cell. 2024. PMID: 38244545
-
Inter-chromosomal contacts demarcate genome topology along a spatial gradient.Nat Commun. 2024 Nov 13;15(1):9813. doi: 10.1038/s41467-024-53983-y. Nat Commun. 2024. PMID: 39532865 Free PMC article.
-
DNA methylation as a mediator of genetic and environmental influences on Parkinson's disease susceptibility: Impacts of alpha-Synuclein, physical activity, and pesticide exposure on the epigenome.Front Genet. 2022 Aug 19;13:971298. doi: 10.3389/fgene.2022.971298. eCollection 2022. Front Genet. 2022. PMID: 36061205 Free PMC article. Review.
-
Targeting neuronal epigenomes for brain rejuvenation.EMBO J. 2024 Aug;43(16):3312-3326. doi: 10.1038/s44318-024-00148-8. Epub 2024 Jul 15. EMBO J. 2024. PMID: 39009672 Free PMC article. Review.
References
-
- Benjamini Y., Hochberg Y. (1995). Controlling the false discovery rate: a practical and powerful approach to multiple testing. J. R. Stat. Soc. Ser. B 57 289–300. 10.2307/2346101 - DOI

