. 2021 Aug:560:34-42.
doi: 10.1016/j.virol.2021.04.009. Epub 2021 May 6.

Interactions between capsid and viral RNA regulate Chikungunya virus translation in a host-specific manner

Affiliations

Interactions between capsid and viral RNA regulate Chikungunya virus translation in a host-specific manner

Lauren M Kiser et al. Virology. 2021 Aug.

Abstract

Alphaviruses are positive sense, RNA viruses commonly transmitted by an arthropod vector to a mammalian or avian host. In recent years, a number of the Alphavirus members have reemerged as public health concerns. Transmission from mosquito vector to vertebrate hosts requires an understanding of the interaction between the virus and both vertebrate and insect hosts to develop rational intervention strategies. The current study uncovers a novel role for capsid protein during Chikungunya virus replication whereby the interaction with viral RNA in the E1 coding region regulates protein synthesis processes early in infection. Studies done in both the mammalian and mosquito cells indicate that interactions between viral RNA and capsid protein have functional consequences that are host species specific. Our data support a vertebrate-specific role for capsid:vRNA interaction in temporally regulating viral translation in a manner dependent on the PI3K-AKT-mTOR pathway.

Keywords: Alphavirus; Capsid protein; PI3K-AKT-mTOR; Translation.


Conflict of interest statement

Declaration of interests

The authors declare that they have no known competing financial interests or personal relationships that could have appeared to influence the work reported in this paper.

Figures

Figure 1.
Figure 1.. Chikungunya virus capsid:vRNA interaction profile identifies binding site in E1 coding region that affects specific infectivity.
A) Anti-Capsid CLIP-seq library results aligned to the viral genome. Libraries were derived from the cytoplasmic fraction at 18HPI and represent regions of significant capsid protein interaction during replication. B) Magnification of the peak located in the E1 coding region. Left Y-axis quantifies the conservation of this region by the prevalence of single nucleotide polymorphisms (SNPs) identified from a set of CHIKV genomic RNA’s. The sequence identified as interacting with capsid (top) and the mutations introduce (bottom in red) span a 45-nucleotide region under the curve. Amino acid sequence for this region is listed below the corresponding RNA sequence. C) Immunoprecipitation of capsid protein shows a significant reduction in co-precipitated RNA retrieved for the 9900 region following introduction of mutations as measured by qRT-PCR. Error bars represent standard deviation from the mean. P-value calculated by unpaired T-test (p= 0.02). D) TEM analysis of purified particles shows no significant structural changes when disrupting capsid:vRNA interaction at the 9900 region. E) Average half-life of incoming viral genomic RNA following synchronized infection of BHK-21 cells. Comparative analysis of three biological replicated using Student’s t-test with error bars representing standard deviation of the mean (p=0.41).
Figure 2.
Figure 2.. 9900 mutant shows attenuation when grown in mammalian cells, but not in insect cells.
Multi-step growth curve for WT CHIKV and 9900 mutant on BHK-21 (A) and C6/36 (B) cell lines shows differences in attenuation. Cells were infected with an MOI of 0.01 and samples were taken for 24 (BHK) 48 (C6/36) hours to measure viral output. All samples were titered on BHK-21 cells to determine PFU. Data shown is of three biological replicates. Error bars represent the standard deviation from the mean.
Figure 3.
Figure 3.. 9900 mutant exhibits increase in early translational events.
A) RNA quantification at 6 and 12 HPI indicates no difference in plus-sense RNA synthesis between WT and the 9900 mutant. Error bars represent the standard deviation of the mean from three biological replicates. Quantification of cellular RNA was by qRT-PCR using E1 primers to quantify total positive sense viral RNA at the indicated time points and normalized to nop2 cellular RNA copy numbers. B-C) Metabolic labeling of infected BHK-21 cells with [35S] methionine at 4 and 8 HPI (B) or 6 and 12 HPI (C). Cells were infected with an MOI 1 and labeling was done an hour before the indicated time points. Data represent translation kinetics at that time of labeling as described in the methods. Images are representative of multiple biological replicates. Black lines between lanes are present to clearly indicate the removal of lanes irrelevant to this study. All comparisons being made are of samples from the same gel and same autoradiographic exposure.
Figure 4.
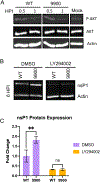
Figure 4.. Analysis of PI3K-AKT-mTOR pathway activation and impact of pathway on 9900 mutant virus translation.
A) Western blot analysis of phosphorylated AKT following infection of BHK-21 cell at 30 minutes and 1 hour post infection. B) Inhibition of PI3K activity negatively affects early translation of nonstructural proteins by 9900 mutant virus. BHK-21 cells were pretreated with either DMSO or LY290002, as described in methods. Cells were infected with an MOI of 10 PFU/cell and lysed at 6 HPI. Lysates were exposed to SDS-PAGE, and nsP1 detected by western blot using anti-nsP1 antibody. Data shown is a representative of biological and technical replicates. C) Fold change of nsP1 protein expression as compared back to WT DMSO expression. Error bars represent the standard deviation from the mean of three biological replicates. P-value calculated by ANOVA (p=0.02).
Figure 5.
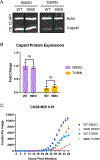
Figure 5.. Inhibition with TORIN has a greater effect on 9900 mutant than WT.
A) Western blot analysis of capsid protein translation in the presence or absence of the mTOR inhibitor, TORIN. BHK-21 cells were treated with TORIN or DMSO and infected with an MOI 10. Cell lysates were collected 8 HPI and subject to western blot analysis using antibodies against actin and capsid protein. Membrane was cut following protein transfer and before antibody probing to prevent cross reactivity. B) Fold change of capsid protein expression as compared back to WT DMSO expression. Error bars represent the standard deviation from the mean of three biological replicates. P-value calculated by ANOVA (p=0.011). C-D) Effect on viral spread in the presence or absence of TORIN. Cells incubated with DMSO control (C) or TORIN (D) were infected with virus encoding a mKate fluorescent protein at a MOI of 0.01 and were quantified as counts per image over the course of 42 hours. A total of 6 images were taken of each well at each time point. Data shown is of three biological replicates. Error bars represent the standard deviation from the mean.
Figure 6.
Figure 6.. mTOR inhibition affects the 9900 mutant and WT virus replication equally in arthropod cells.
A) Western blot analysis of capsid protein translation in the presence or absence of the mTOR inhibitor, TORIN. C6/36 cells were treated with TORIN or DMSO and infected with an MOI 10. Cell lysates were collected 12 HPI and probed for actin or capsid protein. Data shown is a representative of biological replicates. B) Fold change of capsid protein expression as compared to WT DMSO expression. Error bars represent the standard deviation from the mean of three biological replicates. ANOVA analysis found no significant difference between groups. C) Effect on viral spread in the presence or absence of TORIN. C6/36 cells were infected with virus encoding a mKate fluorescent protein at a MOI of 0.01 and spread measured by fluorescent counts per image over the course of 48 hours. A total of 6 images were taken of each well at each time point. Data shown for three biological replicates. Error bars represent the standard deviation from the mean.

Similar articles

Cited by

References

    1. Ahola T and Merits A (2016). “Functions of Chikungunya Virus Nonstructural Proteins.” Chikungunya Virus: Advances in Biology, Pathogenesis, and Treatment: 75–98.
    1. Arias-Goeta C, Moutailler S, Mousson L, Zouache K, Thiberge JM, Caro V, Rougeon F and Failloux AB (2014). “Chikungunya virus adaptation to a mosquito vector correlates with only few point mutations in the viral envelope glycoprotein.” Infect Genet Evol 24: 116–126. - PubMed
    1. Ascano M, Hafner M, Cekan P, Gerstberger S and Tuschl T (2012). “Identification of RNA–protein interaction networks using PAR-CLIP.” WIREs RNA 3(2): 159–177. - PMC - PubMed
    1. Broeckel R, Sarkar S, May NA, Totonchy J, Kreklywich CN, Smith P, Graves L, DeFilippis VR, Heise MT, Morrison TE, Moorman N and Streblow DN (2019). “Src Family Kinase Inhibitors Block Translation of Alphavirus Subgenomic mRNAs.” Antimicrobial Agents and Chemotherapy 63(4): e02325–02318. - PMC - PubMed
    1. Brown RS, Anastasakis DG, Hafner M and Kielian M (2020). “Multiple capsid protein binding sites mediate selective packaging of the alphavirus genomic RNA.” Nature Communications 11(1): 4693. - PMC - PubMed

Publication types

MeSH terms