Comprehensive phenotyping of erythropoiesis in human bone marrow: Evaluation of normal and ineffective erythropoiesis
- PMID: 34021930
- PMCID: PMC8355124
- DOI: 10.1002/ajh.26247
Comprehensive phenotyping of erythropoiesis in human bone marrow: Evaluation of normal and ineffective erythropoiesis
Abstract
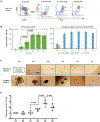
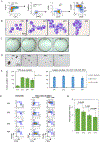
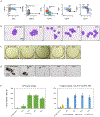
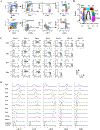
Identification of stage-specific erythroid cells is critical for studies of normal and disordered human erythropoiesis. While immunophenotypic strategies have previously been developed to identify cells at each stage of terminal erythroid differentiation, erythroid progenitors are currently defined very broadly. Refined strategies to identify and characterize BFU-E and CFU-E subsets are critically needed. To address this unmet need, a flow cytometry-based technique was developed that combines the established surface markers CD34 and CD36 with CD117, CD71, and CD105. This combination allowed for the separation of erythroid progenitor cells into four discrete populations along a continuum of progressive maturation, with increasing cell size and decreasing nuclear/cytoplasmic ratio, proliferative capacity and stem cell factor responsiveness. This strategy was validated in uncultured, primary erythroid cells isolated from bone marrow of healthy individuals. Functional colony assays of these progenitor populations revealed enrichment of BFU-E only in the earliest population, transitioning to cells yielding BFU-E and CFU-E, then CFU-E only. Utilizing CD34/CD105 and GPA/CD105 profiles, all four progenitor stages and all five stages of terminal erythroid differentiation could be identified. Applying this immunophenotyping strategy to primary bone marrow cells from patients with myelodysplastic syndrome, identified defects in erythroid progenitors and in terminal erythroid differentiation. This novel immunophenotyping technique will be a valuable tool for studies of normal and perturbed human erythropoiesis. It will allow for the discovery of stage-specific molecular and functional insights into normal erythropoiesis as well as for identification and characterization of stage-specific defects in inherited and acquired disorders of erythropoiesis.
© 2021 Wiley Periodicals LLC.
Conflict of interest statement
Conflict of interests
None.
Figures


Similar articles
-
Flow Cytometry (FCM) Analysis and Fluorescence-Activated Cell Sorting (FACS) of Erythroid Cells.Methods Mol Biol. 2018;1698:153-174. doi: 10.1007/978-1-4939-7428-3_9. Methods Mol Biol. 2018. PMID: 29076089
-
Isolation and transcriptome analyses of human erythroid progenitors: BFU-E and CFU-E.Blood. 2014 Dec 4;124(24):3636-45. doi: 10.1182/blood-2014-07-588806. Epub 2014 Oct 22. Blood. 2014. PMID: 25339359 Free PMC article.
-
Elucidation of the EP defect in Diamond-Blackfan anemia by characterization and prospective isolation of human EPs.Blood. 2015 Apr 16;125(16):2553-7. doi: 10.1182/blood-2014-10-608042. Epub 2015 Mar 9. Blood. 2015. PMID: 25755292
-
Characterization, regulation, and targeting of erythroid progenitors in normal and disordered human erythropoiesis.Curr Opin Hematol. 2017 May;24(3):159-166. doi: 10.1097/MOH.0000000000000328. Curr Opin Hematol. 2017. PMID: 28099275 Free PMC article. Review.
-
Dynamics of human hematopoietic stem and progenitor cell differentiation to the erythroid lineage.Exp Hematol. 2023 Jul;123:1-17. doi: 10.1016/j.exphem.2023.05.001. Epub 2023 May 10. Exp Hematol. 2023. PMID: 37172755 Free PMC article. Review.
Cited by
-
Analysis of Immunophenotypic Changes during Ex Vivo Human Erythropoiesis and Its Application in the Study of Normal and Defective Erythropoiesis.Cells. 2023 May 2;12(9):1303. doi: 10.3390/cells12091303. Cells. 2023. PMID: 37174702 Free PMC article.
-
Epo-IGF1R cross talk expands stress-specific progenitors in regenerative erythropoiesis and myeloproliferative neoplasm.Blood. 2022 Dec 1;140(22):2371-2384. doi: 10.1182/blood.2022016741. Blood. 2022. PMID: 36054916 Free PMC article.
-
Multidimensional profiling reveals GATA1-modulated stage-specific chromatin states and functional associations during human erythropoiesis.Nucleic Acids Res. 2023 Jul 21;51(13):6634-6653. doi: 10.1093/nar/gkad468. Nucleic Acids Res. 2023. PMID: 37254808 Free PMC article.
-
Uncovering a Cryptic Site of Malaria Pathogenesis: Models to Study Interactions Between Plasmodium and the Bone Marrow.Front Cell Infect Microbiol. 2022 Jun 2;12:917267. doi: 10.3389/fcimb.2022.917267. eCollection 2022. Front Cell Infect Microbiol. 2022. PMID: 35719356 Free PMC article. Review.
-
An RPS19-edited model for Diamond-Blackfan anemia reveals TP53-dependent impairment of hematopoietic stem cell activity.JCI Insight. 2023 Jan 10;8(1):e161810. doi: 10.1172/jci.insight.161810. JCI Insight. 2023. PMID: 36413407 Free PMC article.
References
-
- Loken M, Shah V, Dattilio K, Civin C. Flow cytometric analysis of human bone marrow. II. Normal B lymphocyte development. Blood. 1987;70(5):1316–1324. - PubMed
-
- Terstappen LWMM, Safford M, Loken MR. Flow cytometric analyisis of human bone marrow III. Neutrophil maturation. Leukemia. 1990;4(9):657–663. - PubMed
-
- Terstappen LWMM, Loken MR. Myeloid cell differentia tion in normal bone marrow and acute myeloid leukemia assessed by multi-dimensional flow cytometry. Anal cullular Pathol. 1990;2:229–240. - PubMed
-
- Robinson J, Sieff C, Delia D, Edwards PA, Greaves M. Expression of cell-surface HLA-DR, HLA-ABC and glycophorin during erythroid differentiation. Nature. 1981;289(5793):68–71. - PubMed
Publication types
MeSH terms
Substances
Grants and funding
LinkOut - more resources
Full Text Sources
Other Literature Sources
