. 2021 Aug;99(8):1151-1171.
doi: 10.1007/s00109-021-02089-9. Epub 2021 May 20.

LMO3 reprograms visceral adipocyte metabolism during obesity

Affiliations

LMO3 reprograms visceral adipocyte metabolism during obesity

Gabriel Wagner et al. J Mol Med (Berl). 2021 Aug.

Abstract

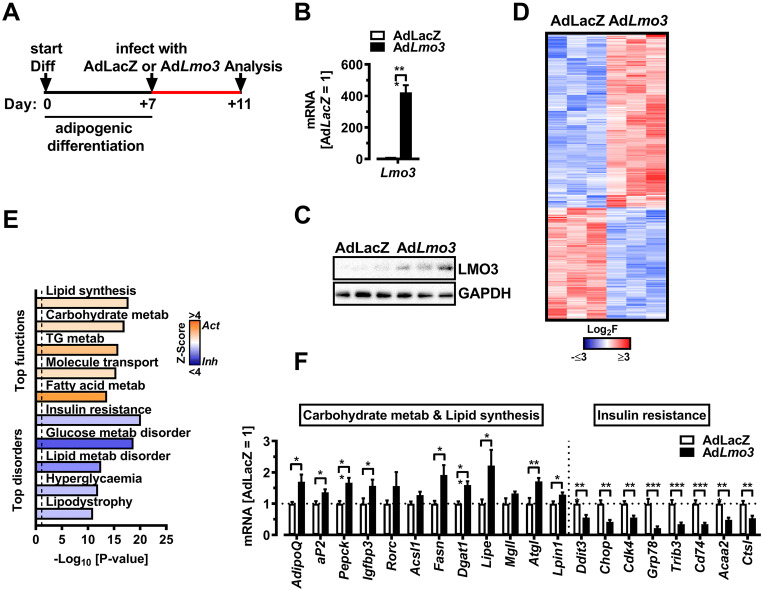
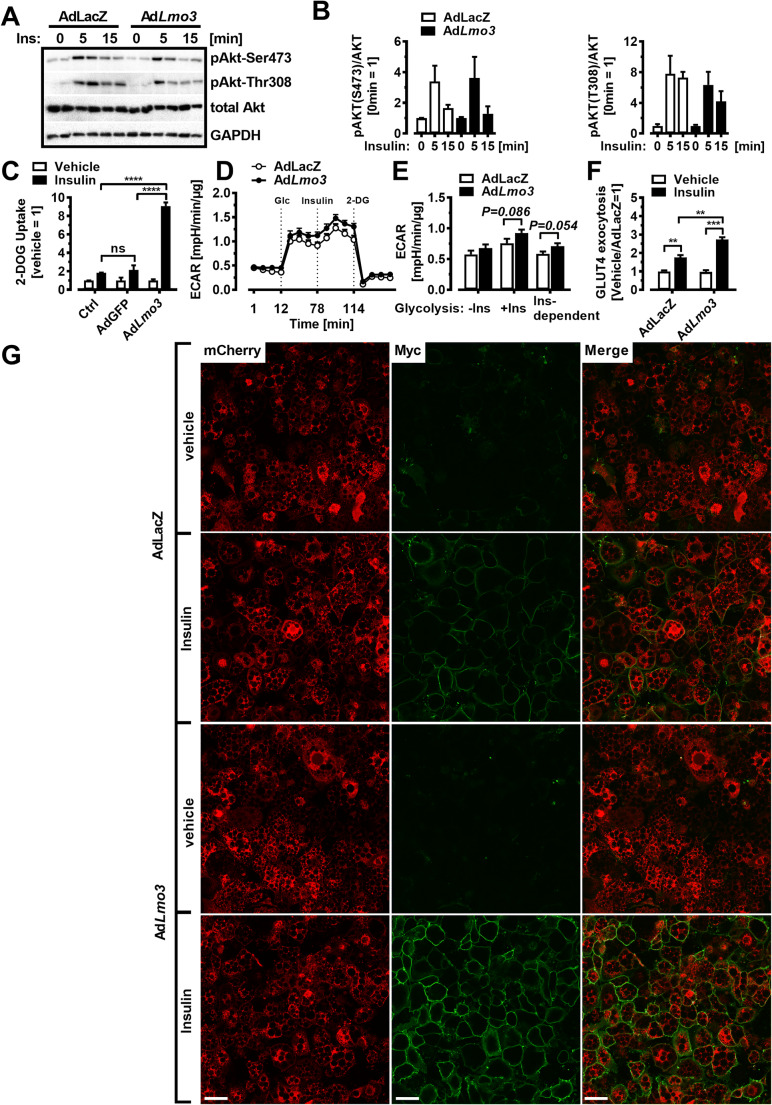
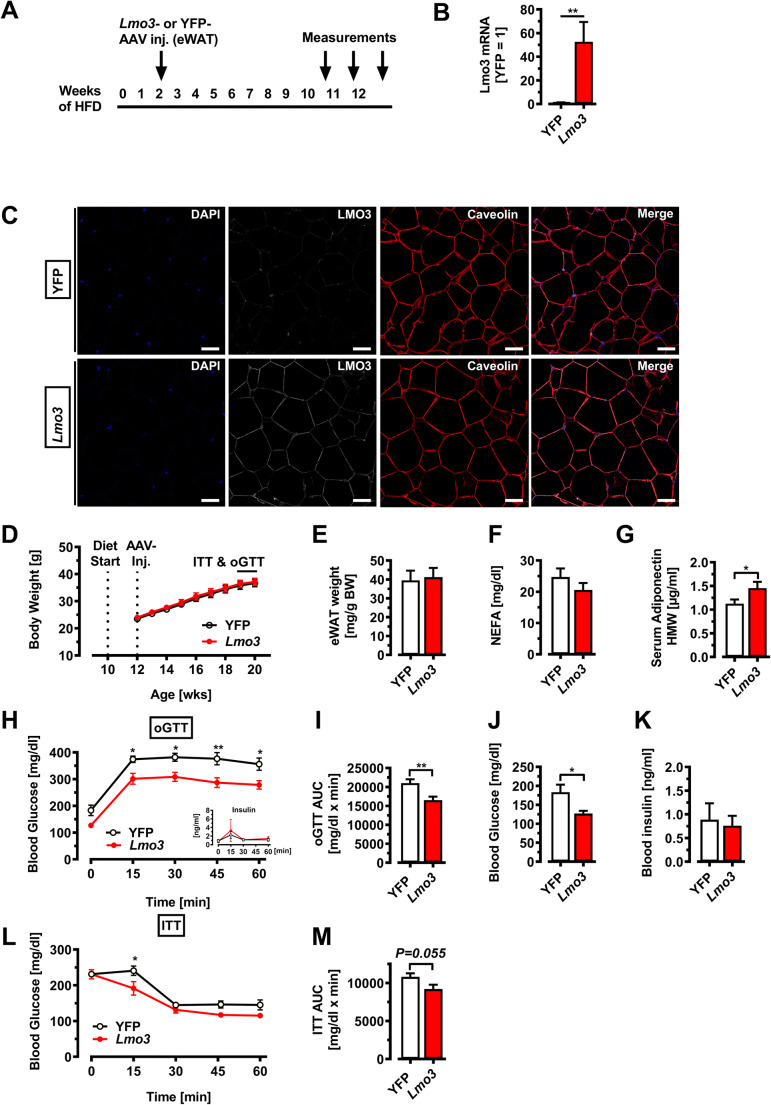
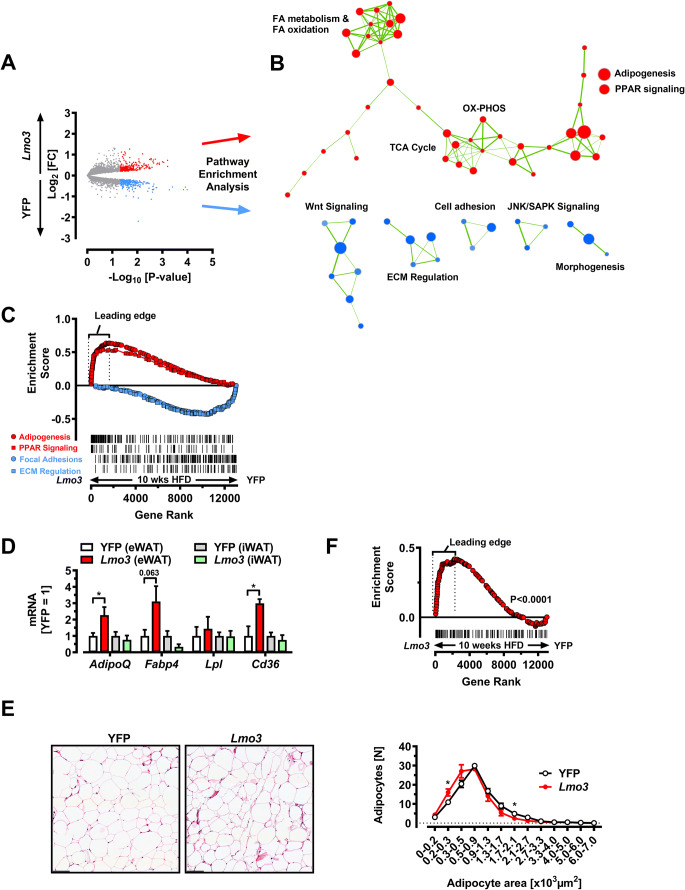
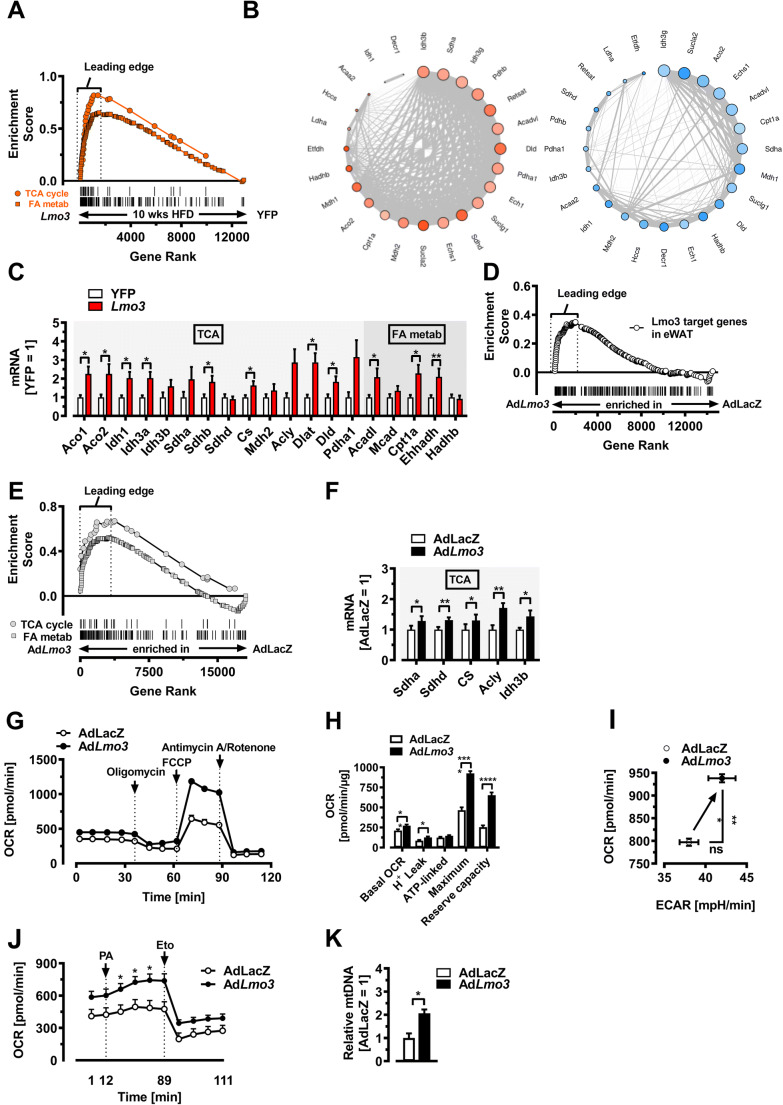
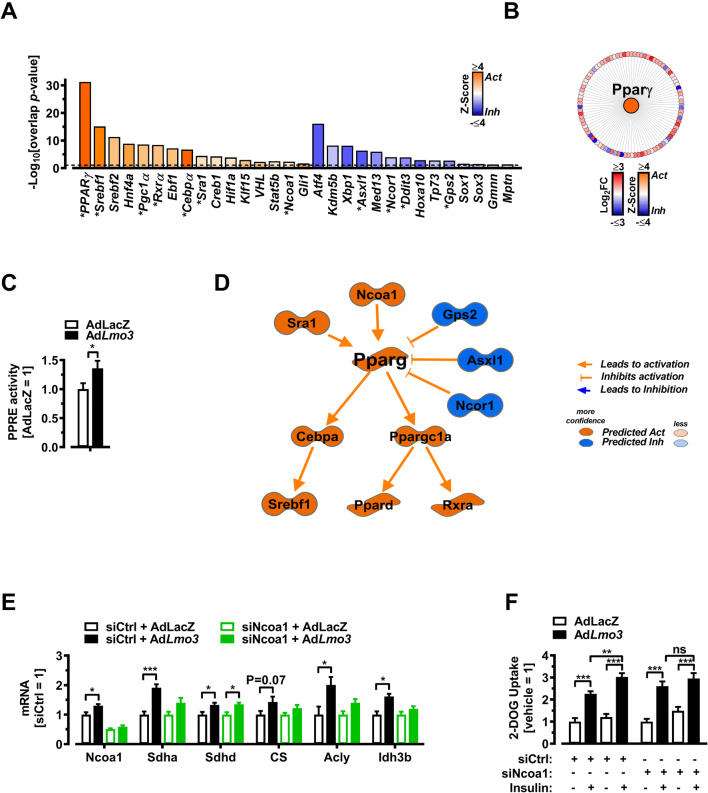
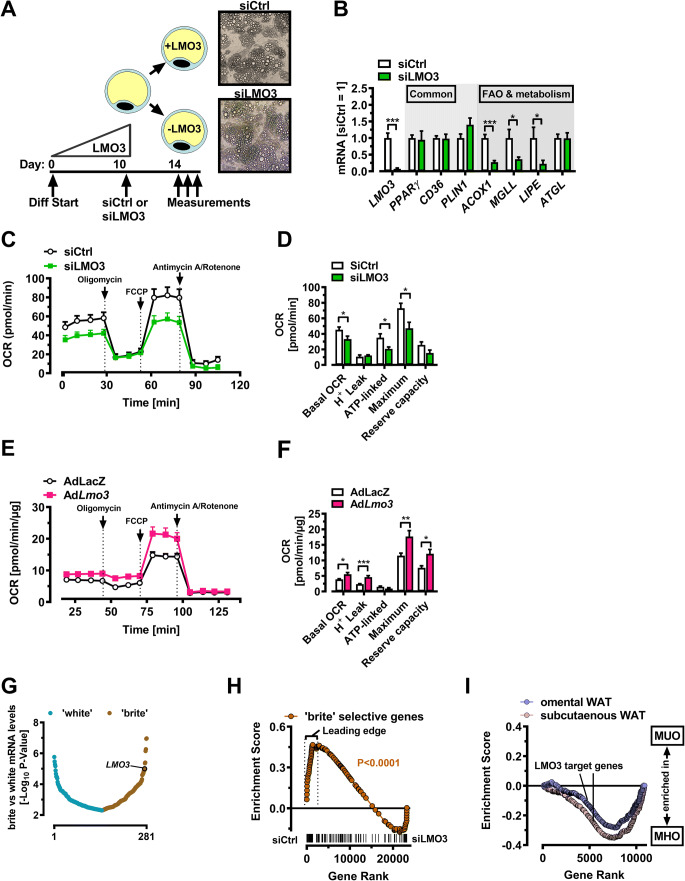
Obesity and body fat distribution are important risk factors for the development of type 2 diabetes and metabolic syndrome. Evidence has accumulated that this risk is related to intrinsic differences in behavior of adipocytes in different fat depots. We recently identified LIM domain only 3 (LMO3) in human mature visceral adipocytes; however, its function in these cells is currently unknown. The aim of this study was to determine the potential involvement of LMO3-dependent pathways in the modulation of key functions of mature adipocytes during obesity. Based on a recently engineered hybrid rAAV serotype Rec2 shown to efficiently transduce both brown adipose tissue (BAT) and white adipose tissue (WAT), we delivered YFP or Lmo3 to epididymal WAT (eWAT) of C57Bl6/J mice on a high-fat diet (HFD). The effects of eWAT transduction on metabolic parameters were evaluated 10 weeks later. To further define the role of LMO3 in insulin-stimulated glucose uptake, insulin signaling, adipocyte bioenergetics, as well as endocrine function, experiments were conducted in 3T3-L1 adipocytes and newly differentiated human primary mature adipocytes, engineered for transient gain or loss of LMO3 expression, respectively. AAV transduction of eWAT results in strong and stable Lmo3 expression specifically in the adipocyte fraction over a course of 10 weeks with HFD feeding. LMO3 expression in eWAT significantly improved insulin sensitivity and healthy visceral adipose tissue expansion in diet-induced obesity, paralleled by increased serum adiponectin. In vitro, LMO3 expression in 3T3-L1 adipocytes increased PPARγ transcriptional activity, insulin-stimulated GLUT4 translocation and glucose uptake, as well as mitochondrial oxidative capacity in addition to fatty acid oxidation. Mechanistically, LMO3 induced the PPARγ coregulator Ncoa1, which was required for LMO3 to enhance glucose uptake and mitochondrial oxidative gene expression. In human mature adipocytes, LMO3 overexpression promoted, while silencing of LMO3 suppressed mitochondrial oxidative capacity. LMO3 expression in visceral adipose tissue regulates multiple genes that preserve adipose tissue functionality during obesity, such as glucose metabolism, insulin sensitivity, mitochondrial function, and adiponectin secretion. Together with increased PPARγ activity and Ncoa1 expression, these gene expression changes promote insulin-induced GLUT4 translocation, glucose uptake in addition to increased mitochondrial oxidative capacity, limiting HFD-induced adipose dysfunction. These data add LMO3 as a novel regulator improving visceral adipose tissue function during obesity. KEY MESSAGES: LMO3 increases beneficial visceral adipose tissue expansion and insulin sensitivity in vivo. LMO3 increases glucose uptake and oxidative mitochondrial activity in adipocytes. LMO3 increases nuclear coactivator 1 (Ncoa1). LMO3-enhanced glucose uptake and mitochondrial gene expression requires Ncoa1.

Keywords: LMO3; Obesity; Visceral adipose tissue.


Conflict of interest statement

The authors declare no competing interests.

Figures

Fig. 1
Fig. 1
LMO3 rewires the metabolic transcriptional program in mature adipocytes. A Experimental design for analysis of LMO3 effects in mature 3T3-L1 adipocytes. B Lmo3 mRNA expression in mature 3T3-L1 adipocytes 3 days after infection with a control (AdLacZ) or Lmo3 containing (AdLmo3) adenovirus (n = 4). C LMO3 protein expression in mature 3T3-L1 adipocytes 3 days after infection with a control (AdLacZ) or Lmo3 containing (AdLmo3) adenovirus (n = 3). GAPDH demonstrates equal protein loading. D Heatmap of 1093 genes differentially regulated between AdLmo3- and AdLacZ-transduced 3T3-L1 adipocytes identified by RNA-Seq. Red and blue colors correspond to genes with statistically significant up- and downregulation, respectively (adjusted p-value < 0.05). E Ingenuity Pathway Analysis (IPA)-predicted molecular functions and disorders showing activation Z-scores (bars). Functions/disorders with an overlap p < 0.05 and Z-score −2 < or > 2 by IPA (see “Methods” for description) were predicted to be inhibited or activated. Dotted line indicates p < 0.05. F qRT-PCR analysis of selected genes from the Ingenuity Pathway Analysis (shown in G), (n = 5–7). IPA-predicted upstream regulators (center, colored by Z-score) and target genes (outer circle, colored by Fold Change) in AdLmo3- versus AdLacZ-transduced 3T3-L1 adipocytes
Fig. 2
Fig. 2
LMO3 augments insulin-induced glucose uptake and GLUT4 translocation. A Western blotting for phosphorylated and total AKT in AdLacZ- or AdLmo3-transduced mature 3T3-L1 adipocytes treated with insulin for the indicated times. GAPDH demonstrates equal protein loading. B Densitometry of AKT phosphorylation as shown in (A). C 2-deoxyglucose uptake in Ctrl, AdGFP, or AdLmo3-transduced mature 3T3-L1 adipocytes stimulated with or without insulin (100 nM). P-values were determined by 2-way ANOVA. D ECAR at baseline and after sequential treatment at the indicated time points with glucose (Glc, 5.5 mM), insulin (Ins, 100 nM), and 2-deoxyglucose (2-DG, 100 mM) in AdLacZ- or AdLmo3-transduced mature 3T3-L1 adipocytes. 2-DG was injected to inhibit glycolysis. E Insulin-dependent glycolysis in AdLacZ- or AdLmo3-transduced mature 3T3-L1 adipocytes, which was defined as the difference between insulin-induced glycolysis and basal glycolysis, normalized to total protein. See Figure S2B for detailed calculation. F, G Insulin-stimulated GLUT4 surface exposure in LMO3-overexpressing 3T3-L1 adipocytes. The cells received vehicle or insulin treatment for 15 min after 4-h serum starvation. The ratio of surface to total GLUT4 was quantified by detecting surface GLUT4 through anti-Myc fluorescence immunolabeling and total GLUT4 through mCherry fluorescence in non-permeabilized cells. Data in each group were normalized and expressed as a percentage of insulin-treated control cells. Scale bar: 50 μm. *p < 0.05, **p < 0.01, ***p < 0.001, ns, not significant
Fig. 3
Fig. 3
LMO3 increases glucose clearance and insulin sensitivity in eWAT during obesity. All mice were kept on HFD for 12 weeks and received rAAV-YFP or rAAV-Lmo3 injections into eWAT at week 2 of HFD and were examined 10 weeks later. A Experimental scheme for murine studies. B Lmo3 mRNA expression in eWAT (n = 5/group). C Confocal immunofluorescence of eWAT. Scale bar = 50 μm. D Body weight gain over time (n = 8/group). E eWAT fat pad weight after 10 weeks of HFD (n = 6/group). F Serum free fatty acid levels (n = 10/group). G Serum adiponectin levels (n = 10/group). H Oral glucose tolerance test and corresponding blood glucose and insulin levels in obese mice (n = 6/group). I Area under the curve (AUC) for oGTT (n = 6/group). J Basal blood glucose levels in obese mice (n = 6/group). K Basal blood insulin levels in obese mice (n = 6/group). L Insulin tolerance test and corresponding blood glucose levels in obese mice (n = 6/group). M Area under the curve (AUC) for ITT (n = 6/group). *p < 0.05, **p < 0.01, ***p < 0.001, ns, not significant
Fig. 4
Fig. 4
LMO3 targets PPARγ activity in eWAT during obesity. All data are derived from mice on HFD for 10 weeks following transduction of eWAT with either rAAV-YFP or rAAV-Lmo3. A Log2 fold changes in gene expression data obtained from microarray analysis of eWAT from obese mice (n = 3/group). Red and blue spots correspond to up- and downregulated genes when comparison Lmo3- with YFP gene expression. B Cytoscape enrichment map (p-value cutoff: 0.005, FDR Q-value cutoff: 0.1, overlap cutoff: 0.5) of gene set enrichment analysis (GSEA). Gene sets enriched in viWAT from rAAV-Lmo3 or rAAV-YFP-transduced mice are indicated in red and blue nodes, respectively. Nodes represent gene sets and edges represent mutual overlap. C GSEA of eWAT from obese mice. Nominal ES P-value < 0.0001 for “Adipogenesis” & “PPAR signaling” and for “Focal adhesion” and “ECM Regulation,” respectively. Vertical lines for visualization only. D Q-PCR analysis in eWAT and iWAT from obese mice of PPARγ target genes (n = 6/group). E Left panel: Representative H&E images of eWAT from rAAV-YFP- or rAAV-Lmo3-transduced mice. Scale bar 100 μm. Right panel: Quantification of adipocyte size. Total 250–350 cells per group were measured (n = 4/group). F GSEA of eWAT from obese mice. Nominal ES P-value < 0.0001 for a custom-gene set derived from human adipose tissue displaying adipose hypertrophy or hyperplasia [31]. The leading edge of this gene set includes genes implicated in lipid droplet growth and regulation of adipocyte morphology including Cidea [58], Pparα [59], and Bnip3 [60]. *p < 0.05, **p < 0.01, ***p < 0.001, ns, not significant
Fig. 5
Fig. 5
LMO3 increases adipocyte mitochondrial oxidative capacity. eWAT data displayed in (A) to (C) were from mice on HFD for 10 weeks following transduction of eWAT with either rAAV-YFP or rAAV-Lmo3. A GSEA of eWAT from obese mice. Nominal ES P-value < 0.0001 for “TCA cycle” and “FA metabolism.” Vertical lines for visualization only. B Network plots for 24 genes common to the “Leading edge” of OX-PHOS, TCA-cycle, and FA metabolism from the BioCarta, KEGG, and GO compendium. Blue node color represents downregulation and red node color represents upregulation of gene expression in eWAT. The node size is associated with the gene’s co-expression in the entire dataset. The edge (line) thickness is linked to the gene’s connectivity (co-expression within the module). C Q-PCR analysis in eWAT from obese mice of selected genes from “TCA cycle” & “FA metabolism” gene sets analyzed by GSEA as shown in (A) (n = 8/group). D GSEA of AdLacZ- or AdLmo3-transduced mature 3T3-L1 adipocytes for a custom-gene set featuring 212 rAAV-Lmo3-induced genes (Fig. 4A and Supplemental Table; nominal ES P-value < 0.0001). Vertical lines for visualization only. E GSEA of AdLacZ- or AdLmo3-transduced 3T3-L1 adipocytes. Nominal ES P-value < 0.0001. F Q-PCR analysis in AdLacZ- or AdLmo3-transduced 3T3-L1 adipocytes of selected genes from the “TCA cycle” gene set analyzed by GSEA shown in (E) (n = 5/group). G Oxygen consumption rates (OCRs) of AdLacZ- and AdLmo3-transduced 3T3-L1 adipocytes (n = 11). H OCR and mitochondrial function parameters of AdLacZ and AdLmo3 3T3-L1 adipocytes (n = 11). I OCR and extracellular acidification rates (ECAR) of AdLacZ- and AdLmo3-transduced 3T3-L1 adipocytes (n = 11). J OCR kinetics in AdLacZ and AdLmo3 3T3-L1 adipocytes after sequential injection of palmitate (PA; 10 μM) and etomoxir (Eto, 100 mM) (n = 5). K Q-PCR analysis of mitochondrial DNA content in AdLacZ- or AdLmo3-transduced 3T3-L1 adipocytes (n = 3). *p < 0.05, **p < 0.01, ***p < 0.001, ns, not significant
Fig. 6
Fig. 6
LMO3 increases mitochondrial oxidative gene expression and glucose uptake via NCoA1/SRC-1. A IPA-predicted upstream regulators from AdLmo3- versus AdLacZ-transduced 3T3-L1 adipocytes showing activation Z-score (bars). Top-15 transcriptional regulators with an overlap p < 0.05 by IPA (see “Methods” for description) were predicted to be upstream regulators. *indicates genes comprising the IPA-predicted mechanistic network displayed in (D). B IPA-predicted upstream regulators (center, colored by Z-score) and target genes (outer circle, colored by Fold Change) in AdLmo3- versus AdLacZ-transduced 3T3-L1 adipocytes. C ELISA-based PPARγ transcription reporter assay demonstrating that LMO3 activated PPARγ transcriptional activity in mature adipocytes compared with LacZ controls (n = 6). D IPA-predicted mechanistic network based on upstream regulators as shown in (F). See supplemental information for gene symbol description. See Figure S1B for explanation of molecule shapes. E Q-PCR analysis of selected “TCA cycle” genes in siCtr- or siNcoa1-transfected control (AdLacZ-) or LMO3-overexpressing (AdLmo3) 3T3-L1 adipocytes (n = 5). F Glucose uptake in in siCtr- or siNcoa1-transfected control (AdLacZ-) or LMO3-overexpressing 3T3-L1 adipocytes (n = 5). After 4-h serum starvation, the cells received mock or insulin treatment for 20 min for measurement of 2-DG uptake. *p < 0.05, **p < 0.01, ***p < 0.001, ns, not significant
Fig. 7
Fig. 7
LMO3 promotes mitochondrial oxidative capacity in human mature adipocytes. A Experimental scheme for silencing LMO3 in human mature adipocytes. Photomicrographs show mature adipocytes 4 days after siRNA transfection. B Q-PCR analysis of selected genes from siCtrl or siLMO3-transfected human mature adipocytes (n = 5–7). C OCR of siCtrl- or siLMO3-transfected human mature adipocytes (n = 8–11). D OCR and mitochondrial function parameters of siCtrl- or siLMO3-transfected human mature adipocytes (n = 8–11). E OCR of AdLacZ- or AdLmo3-transduced human mature adipocytes (n = 11). F OCR and mitochondrial function of AdLacZ- or AdLmo3-transduced human mature adipocytes (n = 11). G Rank order of 281 human white adipocyte genes correlating with forskolin treatment (forskolin vs. vehicle, P-value < 0.005) obtained from public data [41]. H GSEA of genes induced in “brite” adipocytes [41] in siCtrl- versus siLMO3-transfected mature human adipocytes. P-value of the Nominal Enrichment Score for the indicated gene set is indicated. I GSEA of adipocyte LMO3 target genes in WAT derived from metabolically “healthy” (MHO) or “unhealthy” (MUO) morbidly obese patients based on HOMA-IR [42] using a custom gene set composed of LMO3-regulated genes in human mature adipocytes. Note that LMO3-induced genes are enriched in MHO patients. NES P-value < 0.0001 for both, omental and subcutaneous WAT. *p < 0.05, **p < 0.01, ***p < 0.001, ns, not significant

Similar articles

Cited by

References

    1. Lafontan M, Berlan M. Do regional differences in adipocyte biology provide new pathophysiological insights? Trends Pharmacol Sci. 2003;24(6):276–283. doi: 10.1016/S0165-6147(03)00132-9. - DOI - PubMed
    1. Ibrahim MM. Subcutaneous and visceral adipose tissue: structural and functional differences. Obes Rev. 2010;11(1):11–18. doi: 10.1111/j.1467-789X.2009.00623.x. - DOI - PubMed
    1. Lindroos J, Husa J, Mitterer G, Haschemi A, Rauscher S, Haas R, Gröger M, Loewe R, Kohrgruber N, Schrögendorfer KF, Prager G, Beck H, Pospisilik JA, Zeyda M, Stulnig TM, Patsch W, Wagner O, Esterbauer H, Bilban M. Human but not mouse adipogenesis is critically dependent on LMO3. Cell Metab. 2013;18(1):62–74. doi: 10.1016/j.cmet.2013.05.020. - DOI - PMC - PubMed
    1. Galitzky J, Bouloumie A. Human visceral-fat-specific glucocorticoid tuning of adipogenesis. Cell Metab. 2013;18(1):3–5. doi: 10.1016/j.cmet.2013.06.008. - DOI - PubMed
    1. He W, Barak Y, Hevener A, Olson P, Liao D, le J, Nelson M, Ong E, Olefsky JM, Evans RM. Adipose-specific peroxisome proliferator-activated receptor gamma knockout causes insulin resistance in fat and liver but not in muscle. Proc Natl Acad Sci U S A. 2003;100(26):15712–15717. doi: 10.1073/pnas.2536828100. - DOI - PMC - PubMed

Publication types

MeSH terms