. 2021 May 20;12(1):2989.
doi: 10.1038/s41467-021-23242-5.

Production of viable chicken by allogeneic transplantation of primordial germ cells induced from somatic cells

Affiliations

Production of viable chicken by allogeneic transplantation of primordial germ cells induced from somatic cells

Ruifeng Zhao et al. Nat Commun. .

Retraction in

Abstract

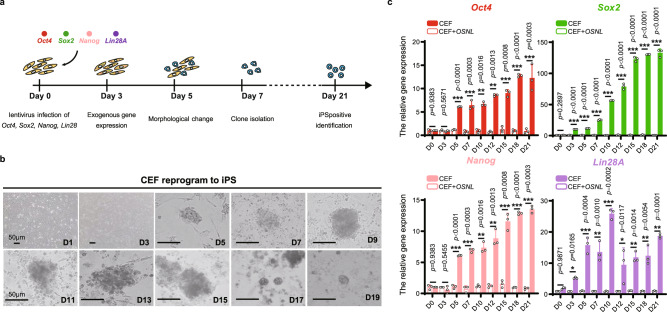
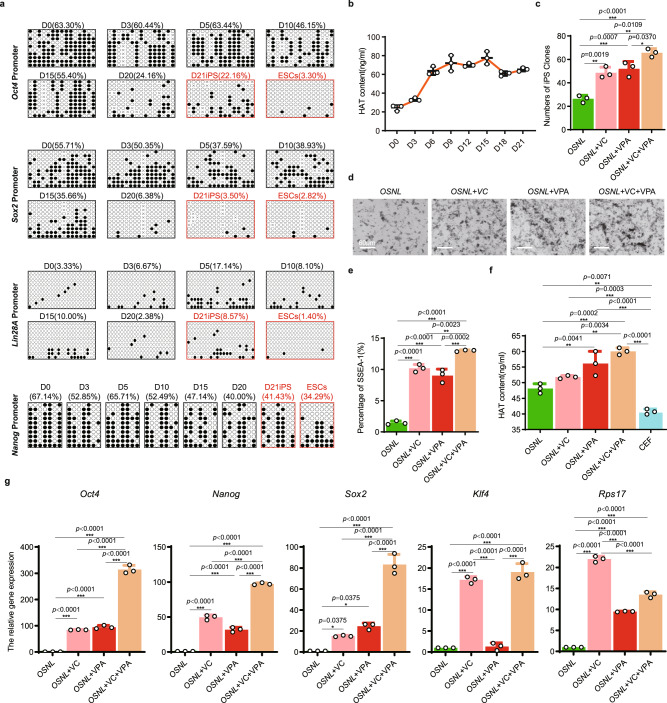
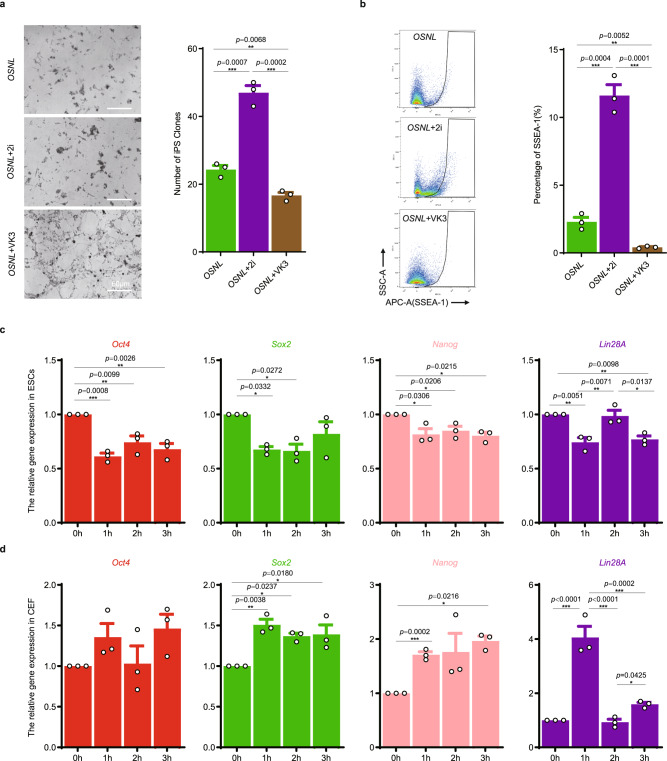
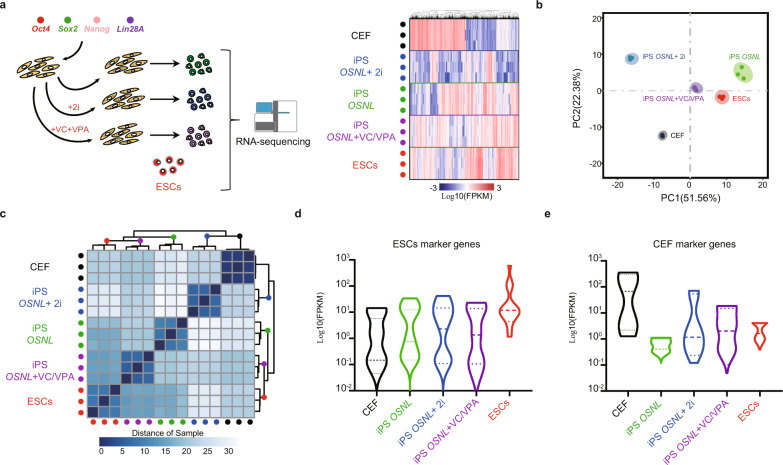
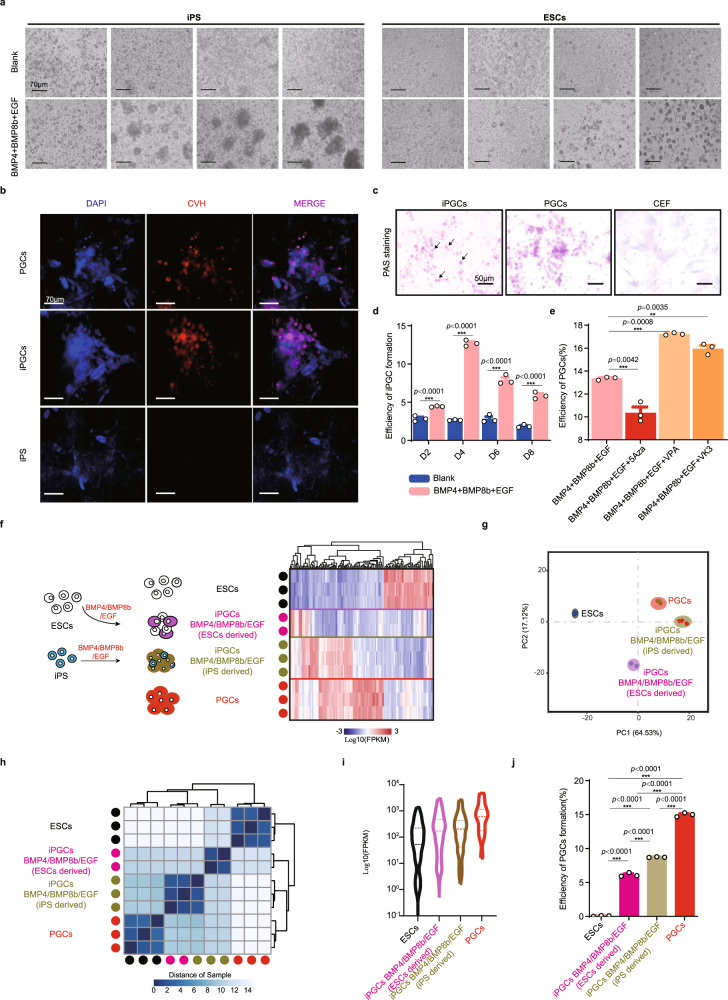
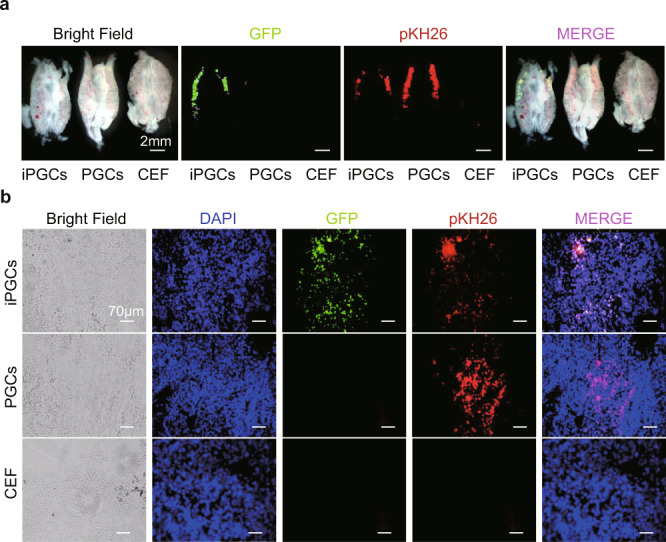
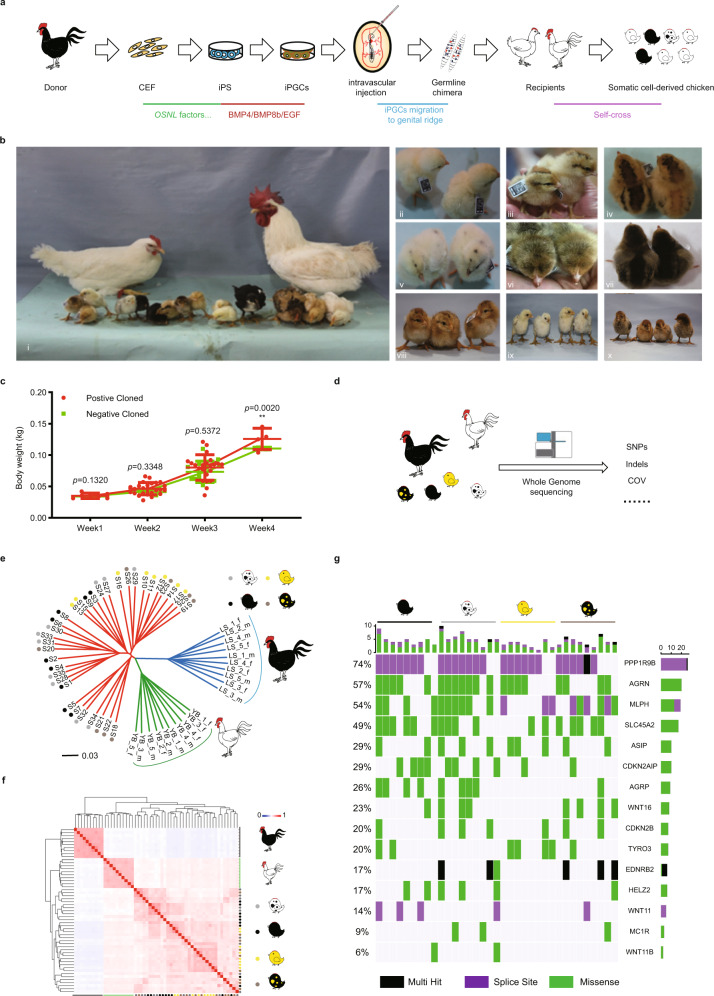
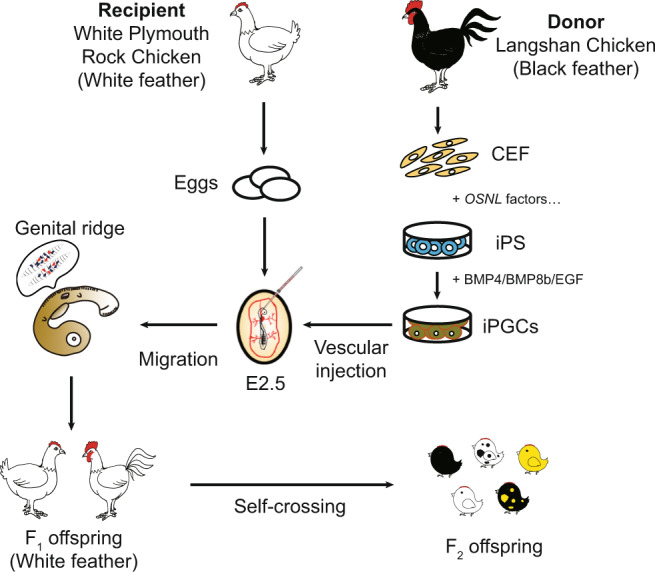
The allogeneic transplantation of primordial germ cells (PGCs) derived from somatic cells overcomes the limitation of avian cloning. Here, we transdifferentiate chicken embryo fibroblasts (CEFs) from black feathered Langshan chickens to PGCs and transplant them into White Plymouth Rock chicken embryos to produce viable offspring with characteristics inherited from the donor. We express Oct4/Sox2/Nanog/Lin28A (OSNL) to reprogram CEFs to induced pluripotent stem cells (iPSCs), which are further induced to differentiate into PGCs by BMP4/BMP8b/EGF. DNA demethylation, histone acetylation and glycolytic activation elevate the iPSC induction efficiency, while histone acetylation and glycolytic inhibition facilitate PGCs formation. The induced PGCs (iPGCs) are transplanted into the recipients, which are self-crossed to produce 189/509 somatic cells derived chicken with the donor's characteristics. Microsatellite analysis and genome sequencing confirm the inheritance of genetic information from the donor. Thus, we demonstrate the feasibility of avian cloning from somatic cells.


Conflict of interest statement

The authors declare no competing interests.

Figures

Fig. 1
Fig. 1. CEFs can be reprogrammed to iPSCs using OSNL factors.
a Schematic diagram of a 21-day iPSC reprogramming process in vitro. The different colored dots represent the four genes of OSNL, OSNL represent Oct4, Sox2 Nanog, and Lin28A. The yellow cells represent CEF, and the blue cells represent iPS. b Morphological characterizations of CEF reprogramming to iPSCs from days 1 to 19, D means day. Scale bar: 50 μm (n = 3 independent experiments). c qRT-PCR evaluation of endogenous reprogramming gene expression from days 0 to 21. A schematic diagram of the primers designed for endogenous OSNL gene expression is shown in Supplementary Fig. 1A. CEFs were used as a negative control (data are shown as mean ± SEM, statistically analyzed by unpaired two-tailed t-test *p < 0.05, **p < 0.01, ***p < 0.001, n = 3 independent experiments).
Fig. 2
Fig. 2. Optimizing the CEF reprogramming system for chicken iPSC production.
a DNA methylation status evaluated by bisulfite sequencing of the OSNL gene promoter regions during iPSC reprogramming from day 0 to day 21, D means day. ESCs were used as the control. Black dots represent methylated sites, and white dots represent unmethylated sites, and ‘×’ represents undetected sites (n = 10 repeats). b ELISA evaluation of histone acetyltransferase (HAT) concentrations from day 0 to day 21 during iPSC formation, (n = 3 independent experiments). c Number of iPSC clones counted after adding the DNA methylase inhibitor VC and/or the histone deacetylase transferase inhibitor VPA to the reprogramming medium on day 21, VC vitamin C, VPA valproic acid. (data are shown as mean ± SEM, n = 3 independent experiments, *p < 0.05, **p < 0.01, ***p < 0.001, one-way ANOVA). d Morphological evaluation of iPSC clones on day 21, Scale bar: 60 μm, (n = 3 independent experiments). e Percentage of SSEA-1-positive cells on reprogramming day 21, (data are shown as mean ± SEM, n = 3 independent experiments, **p < 0.01, ***p < 0.001, one-way ANOVA). f Enzyme-Linked Immunosorbent Assay (ELISA) evaluation of HAT concentration to show the change in histone acetylation status after the addition of VC and/or VPA. CEFs were used as the controls, (data are shown as mean ± SEM, n = 3 independent experiments, **p < 0.01, ***p < 0.001, one-way ANOVA). g qRT-PCR evaluation of the expression of the pluripotent marker genes Nanog, Oct4, Sox2, Klf4, and Rps17. (Data are shown as mean ± SEM, n = 3 independent experiments, *p < 0.05, **p < 0.01, ***p < 0.001, one-way ANOVA).
Fig. 3
Fig. 3. Glycolytic activation facilitates chicken iPSC formation.
a Morphological evaluation and statistical analysis of iPSC clones with glycolytic activation (2i: PD0325901and SB431542) or inhibition (VK3: vitamin K3) in OSNL-induced iPSC formation. Scale bar: 60 m. (Data are shown as mean ± SEM, n = 3 independent experiments, **p < 0.01, ***p < 0.001, one-way ANOVA). b. Flow cytometric analysis of SSEA-1-positive cells in the induced cells with glycolytic activation or inhibition, (data are shown as mean ± SEM, n = 3 independent experiments, **p < 0.01, ***p < 0.001, one-way ANOVA). c, d qRT-PCR evaluation of the expression of the pluripotent genes Oct4, Sox2, Nanog, and Lin28A in ESCs (c) and CEFs (d), (data are shown as mean ± SEM, n = 3 independent experiments, *p < 0.05, **p < 0.01, ***p < 0.001, one-way ANOVA).
Fig. 4
Fig. 4. iPSCs shows ESC-like biological characteristics.
a Schematic diagram of RNA-seq analysis for iPSCs induced by OSNL, ONSL + 2i, and OSNL + VC/VPA. CEFs and ESCs were used as the negative and positive controls, respectively. Unsupervised hierarchical clustering based on ESC development-related genes was applied to analyze the similarities among the cell populations. Heatmap shows the expression profiles of the selected genes. Yellow cells represent CEF, red cells represent ESCs, green, blue, and purple cell represent iPSC from different induction system, and the dots with different colors represent independent samples from different groups for RNA-seq. The color key from blue to red indicates low to high gene expression. b, c Principal Component Analysis (PCA) (b) and correlation analysis (c) of iPSCs induced by OSNL, ONSL + 2i, and OSNL + VC/VPA to ESCs based on the genes selected in unsupervised hierarchical clustering. The color key from blue to white indicates short to long distances between samples. The colored dots represent sequencing data from individual cell samples. d, e Violin plot of ESC and CEF marker gene expression from the RNA-seq data of iPSCs from different groups, ESCs and CEFs. The solid lines at each end of the violin diagram represent the maximum and minimum values, respectively. The three dotted lines in the middle of the violin diagram represent the 75% percentile, the mean, and the 25% percentile in turn.
Fig. 5
Fig. 5. Induction of iPSCs to iPGCs.
a Morphological evaluation of iPGCs induced from iPSCs with BMP4/BMP8b/EGF. ESCs were used as the control. Scale bar: 50 μm, (n = 3 independent experiments). b iPSC-derived iPGCs stained with CVH as a PGC marker. PGCs were used as a positive control, and noninduced iPSCs were used as a negative control. Scale bar: 70 μm, (n = 3 independent experiments). c Periodic acid-Schiff (PAS) staining of iPGCs, PGCs, and CEFs. The arrow shows the PAS positive iPGCs clones. Scale bar: 50 μm, (n = 3 independent experiments). d Flow cytometric analysis of the CVH-positive iPGCs induced from iPSCs. The positive cells were counted on induction days 2, 4, 6, and 8, D means day. (data are shown as mean ± SEM, n = 3 independent experiments, ***p < 0.001, unpaired two-tailed t-test). e Flow cytometric evaluation of the iPGC formation rate in conditions with glycolytic activation, histone acetylation or DNA methylation, (data are shown as mean ± SEM, n = 3 independent experiments, **p < 0.01, ***p < 0.001, unpaired two-tailed t-test). f Schematic diagram of RNA-seq analysis for iPGCs induced from iPSCs and ESCs. ESCs and PGCs were used as the controls. Unsupervised hierarchical clustering based on PGC development-related genes was applied to analyze the similarities among ESCs, ESC-derived iPGCs, iPSC-derived iPGCs, and PGCs. Heatmap shows the expression profiles of the selected genes. The color key from blue to red indicates low to high gene expression. White cells represent ESCs, red cells represent PGCs, blue cells represent iPS, cells with other colored represent iPGCs derived from different induction conditions. Dots with different colors represent independent samples from different groups for RNA-seq. g, h Principal Component Analysis (PCA) (g) and correlation analysis (h) of ESCs, ESC-derived iPGCs, iPSC-derived iPGCs, and PGCs based on the genes selected in unsupervised hierarchical clustering analysis. The color key from blue to white indicates short to long distances between samples. The colored dots represent sequencing data from individual cell samples. i Violin plot of PGC marker genes from RNA-seq data of ESCs, ESC-derived iPGCs, iPSC-derived PGCs and PGCs. The solid lines at each end of the violin diagram represent the maximum and minimum values, respectively. The three dotted lines in the middle of the violin diagram represent the 75% percentile, the mean, and the 25% percentile in turn. j ESCs, ESC-derived iPGCs, iPSC-derived iPGCs and PGCs were treated with pKH26 and injected into the recipients. The migration of the injected cells was evaluated by flow cytometric analysis of the pKH26-positive cells in isolated genital ridges. (Data are shown as mean ± SEM, n = 3 independent experiments, ***p < 0.001, one-way ANOVA).
Fig. 6
Fig. 6. iPGCs migrate to the genital ridge after embryo transplantation.
a Real-time fluorescence observation of genital ridges isolated from chicken embryos transplanted with iPGCs, PGCs, and CEFs. iPGCs, PGCs, and CEFs were treated with pKH26, showing red fluorescence before injection. Green fluorescence was expressed by the OSNL vectors carrying GFP originally transfected into CEFs. Scale bar: 2 mm. (n = 9 chick embryos form three independent experiments). b Fluorescence observation of frozen embryonic genital ridge sections after iPGC, PGC, and CEF transplantation. Scale bar: 70 μm. (n = 9 chick embryos form three independent experiments).
Fig. 7
Fig. 7. Production and identification of somatic cell-derived chickens.
a Schematic diagram of viable chicken production from somatic cells. Black feathered Langshan chickens are used as donors, White Plymouth Rock chicken are used as recipients. b i: Sexually mature White Plymouth Rock chickens that received iPGC transplantation in the embryo stage, as well as their positive (n = 189) and negative offspring (n = 320), showing black feathered, white feathered, black-white feathered, yellow feathered, and black-yellow feathered chickens; ii–x: offspring with similar appearance produced by the White Plymouth Rock chickens that received iPGC transplantation in the embryo stage. c Growth rate of the chickens positive for the clones compared with the negative chickens. (Data are shown as the mean ± SD, n = 5, 24, 22, 4 chicken in week 1, 2, 3, 4 in positive group, n = 1, 3, 12, 2 in week 1, 2, 3, 4 chicken in negative group, **p < 0.01, unpaired two-tailed t-test). d Schematic diagram of whole-genome resequencing for the black feathered Langshan chicken, White Plymouth rock chicken and offspring. e Phylogenetic tree of donor black feathered Langshan chickens, recipient White Plymouth Rock chickens and offspring, Scale bar: 0.03 for genetic distance. Different colored dots represent individual sequenced samples. f Genetic similarity index (GSI) analysis of black feathered Langshan chickens, recipient White Plymouth rock chickens and offspring, the color key from blue to red indicates the similarities from low to high between samples. g Distribution of different single nucleotide polymorphism (SNP) loci in feather color-related genes in individuals with different feather color phenotypes. Horizontal axis represents for individuals. The vertical axis represents the proportion of variations. Scale bar represents the number of samples.
Fig. 8
Fig. 8. Schematic diagram of the viable offspring production derived from donor CEF.
CEFs of black feathered Langshan chickens were induced to differentiate into iPGCs and injected into the embryos of White Plymouth Rock chickens. The injected iPGCs migrate to the genital ridge and develop into germ cells. The recipients with transplanted iPGCs produced viable offspring showing characteristics of black feathered Langshan chickens by self-crossing.

Similar articles

Cited by

References

    1. Liu Z, et al. Cloning of macaque monkeys by somatic cell nuclear transfer. Cell. 2018;172:881–887.e7. doi: 10.1016/j.cell.2018.01.020. - DOI - PubMed
    1. Rodriguez-Osorio N, Urrego R, Cibelli JB, Eilertsen K, Memili E. Reprogramming mammalian somatic cells. Theriogenology. 2012;78:1869–1886. doi: 10.1016/j.theriogenology.2012.05.030. - DOI - PubMed
    1. Nakamura Y. Avian biotechnology. Adv. Exp. Med. Biol. 2017;1001:187–214. doi: 10.1007/978-981-10-3975-1_12. - DOI - PubMed
    1. Zhao R, et al. The establishment of clonally derived chicken embryonic fibroblast cell line (CSC) with high transfection efficiency and ability as a feeder cell. J. Cell. Biochem. 2018;119:8841–8850. doi: 10.1002/jcb.27137. - DOI - PubMed
    1. van de Lavoir MC, et al. Germline transmission of genetically modified primordial germ cells. Nature. 2006;441:766–769. doi: 10.1038/nature04831. - DOI - PubMed

Publication types

MeSH terms

Substances