Characterization of brain-derived extracellular vesicle lipids in Alzheimer's disease
- PMID: 34012516
- PMCID: PMC8111496
- DOI: 10.1002/jev2.12089
Characterization of brain-derived extracellular vesicle lipids in Alzheimer's disease
Abstract
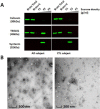
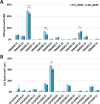
Lipid dyshomeostasis is associated with the most common form of dementia, Alzheimer's disease (AD). Substantial progress has been made in identifying positron emission tomography and cerebrospinal fluid biomarkers for AD, but they have limited use as front-line diagnostic tools. Extracellular vesicles (EVs) are released by all cells and contain a subset of their parental cell composition, including lipids. EVs are released from the brain into the periphery, providing a potential source of tissue and disease specific lipid biomarkers. However, the EV lipidome of the central nervous system is currently unknown and the potential of brain-derived EVs (BDEVs) to inform on lipid dyshomeostasis in AD remains unclear. The aim of this study was to reveal the lipid composition of BDEVs in human frontal cortex, and to determine whether BDEVs have an altered lipid profile in AD. Using semi-quantitative mass spectrometry, we describe the BDEV lipidome, covering four lipid categories, 17 lipid classes and 692 lipid molecules. BDEVs were enriched in glycerophosphoserine (PS) lipids, a characteristic of small EVs. Here we further report that BDEVs are enriched in ether-containing PS lipids, a finding that further establishes ether lipids as a feature of EVs. BDEVs in the AD frontal cortex offered improved detection of dysregulated lipids in AD over global lipid profiling of this brain region. AD BDEVs had significantly altered glycerophospholipid and sphingolipid levels, specifically increased plasmalogen glycerophosphoethanolamine and decreased polyunsaturated fatty acyl containing lipids, and altered amide-linked acyl chain content in sphingomyelin and ceramide lipids relative to CTL. The most prominent alteration was a two-fold decrease in lipid species containing anti-inflammatory/pro-resolving docosahexaenoic acid. The in-depth lipidome analysis provided in this study highlights the advantage of EVs over more complex tissues for improved detection of dysregulated lipids that may serve as potential biomarkers in the periphery.
Keywords: Alzheimer's disease; brain; exosomes; extracellular vesicles; frontal cortex; glycerophospholipids; lipid biomarkers; lipidome; polyunsaturated fatty acids; sphingolipids; tissue.
© 2021 The Authors. Journal of Extracellular Vesicles published by Wiley Periodicals, LLC on behalf of the International Society for Extracellular Vesicles.
Figures


Similar articles
-
Brain Tissue-Derived Extracellular Vesicles in Alzheimer's Disease Display Altered Key Protein Levels Including Cell Type-Specific Markers.J Alzheimers Dis. 2022;90(3):1057-1072. doi: 10.3233/JAD-220322. J Alzheimers Dis. 2022. PMID: 36213994 Free PMC article.
-
Small RNA Profiles of Brain Tissue-Derived Extracellular Vesicles in Alzheimer's Disease.J Alzheimers Dis. 2024;99(s2):S235-S248. doi: 10.3233/JAD-230872. J Alzheimers Dis. 2024. PMID: 37781809
-
Lipid Profiling of Alzheimer's Disease Brain Highlights Enrichment in Glycerol(phospho)lipid, and Sphingolipid Metabolism.Cells. 2021 Sep 29;10(10):2591. doi: 10.3390/cells10102591. Cells. 2021. PMID: 34685570 Free PMC article.
-
Plasma neuronal exosomes serve as biomarkers of cognitive impairment in HIV infection and Alzheimer's disease.J Neurovirol. 2019 Oct;25(5):702-709. doi: 10.1007/s13365-018-0695-4. Epub 2019 Jan 4. J Neurovirol. 2019. PMID: 30610738 Free PMC article. Review.
-
Extracellular Vesicle as a Source of Alzheimer's Biomarkers: Opportunities and Challenges.Int J Mol Sci. 2019 Apr 8;20(7):1728. doi: 10.3390/ijms20071728. Int J Mol Sci. 2019. PMID: 30965555 Free PMC article. Review.
Cited by
-
Lipidomic landscape of lipokines in adipose tissue derived extracellular vesicles.Front Mol Biosci. 2023 Oct 31;10:1281244. doi: 10.3389/fmolb.2023.1281244. eCollection 2023. Front Mol Biosci. 2023. PMID: 38028559 Free PMC article.
-
Mesenchymal Stem Cell-Derived Extracellular Vesicles: A Potential Therapy for Diabetes Mellitus and Diabetic Complications.Pharmaceutics. 2022 Oct 17;14(10):2208. doi: 10.3390/pharmaceutics14102208. Pharmaceutics. 2022. PMID: 36297643 Free PMC article. Review.
-
The Vascular-Immune Hypothesis of Alzheimer's Disease.Biomedicines. 2023 Jan 30;11(2):408. doi: 10.3390/biomedicines11020408. Biomedicines. 2023. PMID: 36830944 Free PMC article. Review.
-
Multi-Omics Analysis of Microglial Extracellular Vesicles From Human Alzheimer's Disease Brain Tissue Reveals Disease-Associated Signatures.Front Pharmacol. 2021 Dec 2;12:766082. doi: 10.3389/fphar.2021.766082. eCollection 2021. Front Pharmacol. 2021. PMID: 34925024 Free PMC article.
-
Research advances of tissue-derived extracellular vesicles in cancers.J Cancer Res Clin Oncol. 2024 Apr 10;150(4):184. doi: 10.1007/s00432-023-05596-z. J Cancer Res Clin Oncol. 2024. PMID: 38598014 Free PMC article. Review.
References
-
- Anand, S. , Barnes, J. M. , Young, S. A. , Garcia, D. M. , Tolley, H. D. , Kauwe, J. S. K. , & Graves, S. W. (2017). Discovery and confirmation of diagnostic serum lipid biomarkers for Alzheimer’s disease using direct infusion mass spectrometry. Journal of Alzheimer's Disease, 59, 277–290. - PubMed
-
- Barupal, D. K. , Baillie, R. , Fan, S. , Saykin, A. J. , Meikle, P. J. , Arnold, M. , Nho, K. , Fiehn, O. , Kaddurah‐DAOUK, R. , & Alzheimer Disease Metabolomics, C. (2019). Sets of coregulated serum lipids are associated with Alzheimer's disease pathophysiology. Alzheimers & Dementia, 11, 619–627. - PMC - PubMed
-
- Bazinet, R. P. , & Laye, S. (2014). Polyunsaturated fatty acids and their metabolites in brain function and disease. Nature Reviews Neuroscience, 15, 771–785. - PubMed
Publication types
MeSH terms
Substances
LinkOut - more resources
Full Text Sources
Other Literature Sources
Medical

