. 2021 May 19;12(1):2942.
doi: 10.1038/s41467-021-23272-z.

Cardiomyocyte contractile impairment in heart failure results from reduced BAG3-mediated sarcomeric protein turnover

Affiliations

Cardiomyocyte contractile impairment in heart failure results from reduced BAG3-mediated sarcomeric protein turnover

Thomas G Martin et al. Nat Commun. .

Abstract

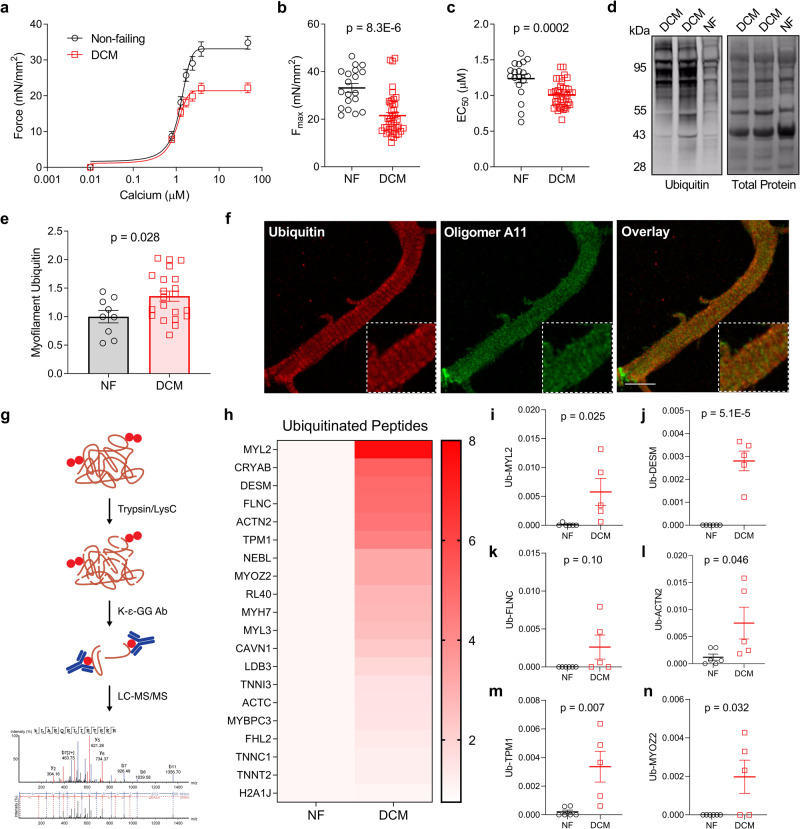
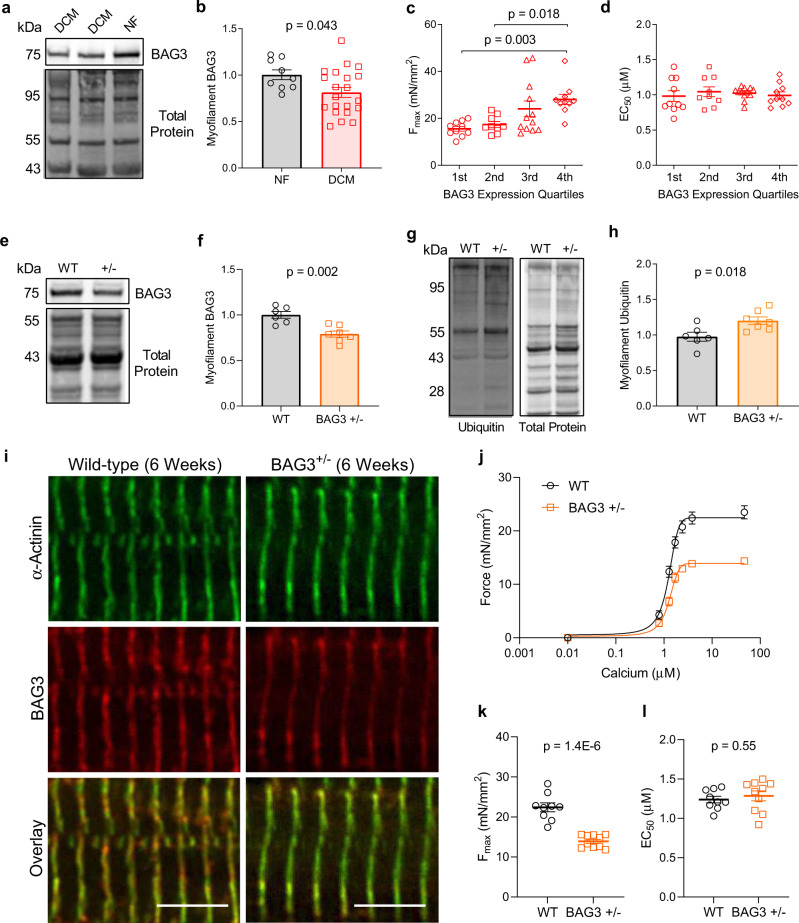
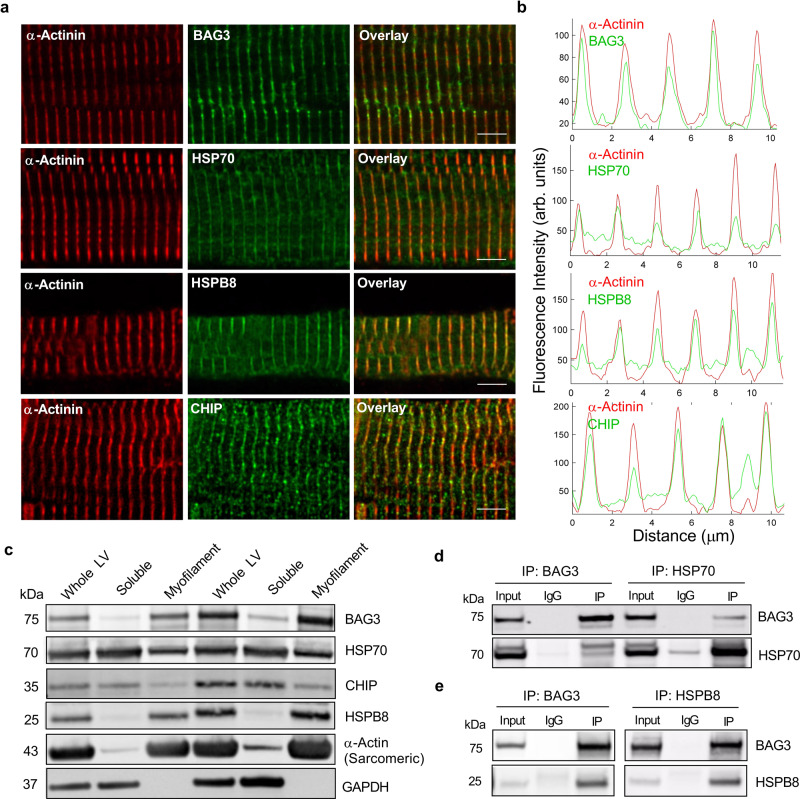
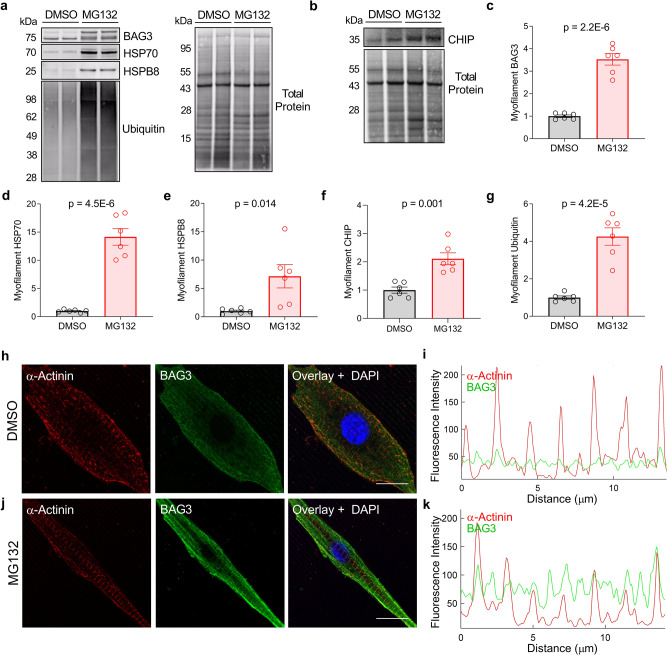
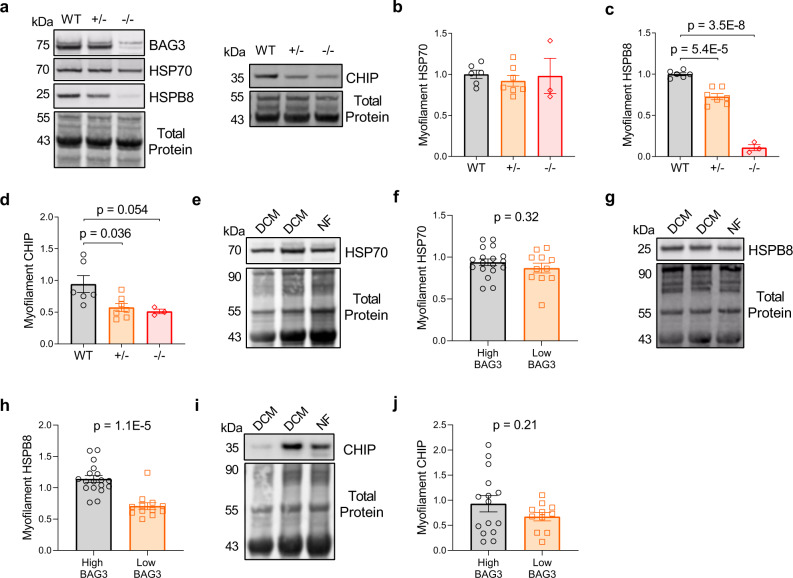
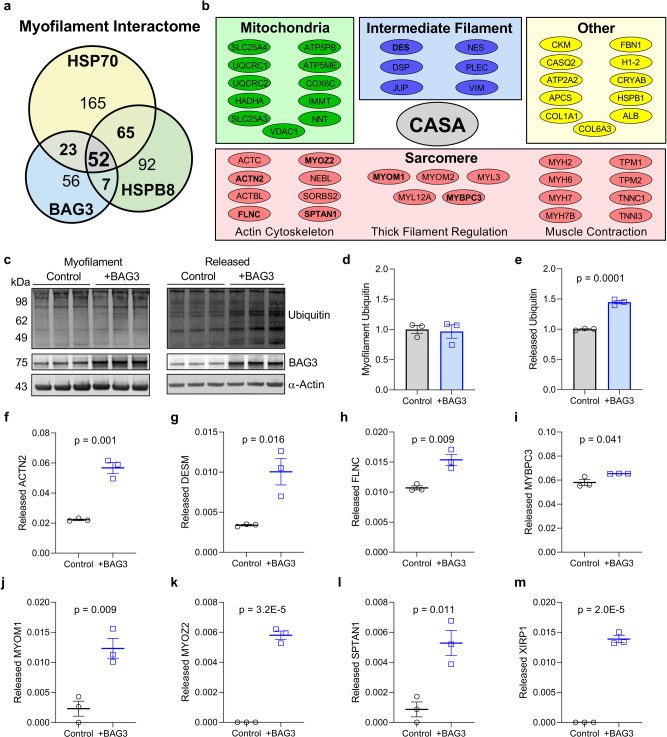
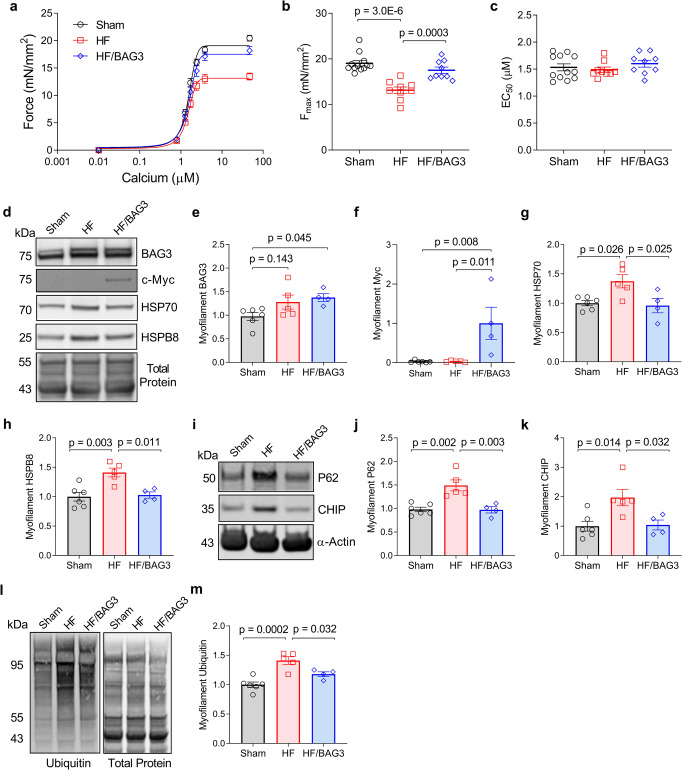
The association between reduced myofilament force-generating capacity (Fmax) and heart failure (HF) is clear, however the underlying molecular mechanisms are poorly understood. Here, we show impaired Fmax arises from reduced BAG3-mediated sarcomere turnover. Myofilament BAG3 expression decreases in human HF and positively correlates with Fmax. We confirm this relationship using BAG3 haploinsufficient mice, which display reduced Fmax and increased myofilament ubiquitination, suggesting impaired protein turnover. We show cardiac BAG3 operates via chaperone-assisted selective autophagy (CASA), conserved from skeletal muscle, and confirm sarcomeric CASA complex localization is BAG3/proteotoxic stress-dependent. Using mass spectrometry, we characterize the myofilament CASA interactome in the human heart and identify eight clients of BAG3-mediated turnover. To determine if increasing BAG3 expression in HF can restore sarcomere proteostasis/Fmax, HF mice were treated with rAAV9-BAG3. Gene therapy fully rescued Fmax and CASA protein turnover after four weeks. Our findings indicate BAG3-mediated sarcomere turnover is fundamental for myofilament functional maintenance.


Conflict of interest statement

A.M.F. has equity in and is a director of Renovacor, Inc., a biotechnology company developing gene therapy for patients with BAG3 genetic variants. The other authors declare no competing interests.

Figures

Fig. 1
Fig. 1. Human DCM is characterized by decreased myofilament function and impaired sarcomere protein turnover.
a Skinned myocyte force-calcium relationship from human nonfailing (NF) and dilated cardiomyopathy (DCM) cardiomyocytes; n = 19 NF from 6 patients, 41 DCM from 12 patients. b, c Summary data for myocyte Fmax (b) and EC50 (c) corresponding to the force-calcium graph in a. d Western blot for ubiquitin in the NF and DCM left ventricle (LV) myofilament fraction; image is representative of 9 NF samples and 21 DCM samples. e Ubiquitin signal normalized to total protein; n = 9 NF, 21 DCM. f Immunofluorescence image of a human LV cardiomyocyte immunostained for ubiquitin and oligomer A11; ×63 magnification, scale bar = 10 µm; image is representative of the 16 images acquired. g Proteomics paradigm for ubiquitinated peptide enrichment. h Heatmap of the top 20 ubiquitinated proteins identified by LC-MS/MS for NF and DCM human patients normalized to total peptide input; scale bar = fold change increase relative to NF, darkest red color denoting greatest fold change. i–n Spectral count data for ubiquitinated peptides normalized to total peptide input for myosin regulatory light chain (i), desmin (j), filamin-C (k), α-actinin (l), tropomyosin (m), and myozenin-2 (n); n = 6 NF, 5 DCM. All data are presented as mean ± SEM and were analyzed by two-tailed t-test.
Fig. 2
Fig. 2. Sarcomeric BAG3 expression decreases in DCM and is associated with reduced myofilament Fmax.
a Western blot for myofilament BAG3 in NF and DCM humans; image is representative of 9 NF samples and 21 DCM samples. b Myofilament BAG3 signal normalized to total protein; n = 9 NF, 21 DCM; two-tailed t-test. c, d DCM myocyte Fmax (c) and EC50 (d) grouped by quartile of BAG3 expression; 1st = lowest BAG3 expressors; n = 12 DCM samples, 3–4 myocytes/sample for functional assessment; one-way ANOVA, Tukey post-hoc. e Western blot for myofilament BAG3 in WT and BAG3+/− mice; image is representative of six WT and seven BAG3+/− samples. f BAG3 signal normalized to total protein; n = 6 WT, 7 BAG3+/−; two-tailed t-test. g Western blot for myofilament ubiquitin in WT and BAG3+/− mice; image is representative of six WT and seven BAG3+/− samples. h Ubiquitin signal normalized to total protein; n = 6 WT, 7 BAG3+/−; two-tailed t-test. i Immunofluorescence image of WT and BAG3+/− cardiomyocytes immunostained for α-actinin and BAG3; ×63 magnification, scale bars = 5 µm; image is representative of the 5/group acquired. j Skinned myocyte force-calcium relationship from WT and BAG3+/− cardiomyocytes; n = 9 WT from 3 mice, 10 BAG3+/− from 3 mice. k, l Summary data for myocyte Fmax (k) and EC50 (l) corresponding to the force-calcium curves in j; two-tailed t-test. All data are presented as mean ± SEM.
Fig. 3
Fig. 3. The CASA complex localizes to the sarcomere Z-disc in cardiomyocytes.
a Immunofluorescence images of human LV cardiomyocytes immunostained for BAG3, HSP70, HSPB8, and CHIP and counterstained for α-actinin; ×63 magnification, scale bars = 5 µm; images are representative 10 images/antibody/5 independent biological samples. b Quantitative line scan of fluorescence intensity by distance from the corresponding green and red channels in panel a. c Western blot for the CASA complex proteins in the whole LV, triton-soluble, and myofilament fractions; sarcomeric α-actin = myofilament fraction positive control, GAPDH = soluble fraction positive control. d Western blot showing results of reciprocal co-immunoprecipitation (IP) for BAG3 and HSP70 in myofilament fraction (IgG—non--specific antibody control); images are representative of three independent experiments. e Western blot showing results of reciprocal co-immunoprecipitation for BAG3 and HSPB8 in myofilament fraction; images are representative of three independent experiments.
Fig. 4
Fig. 4. The CASA complex is targeted to the sarcomere in response to proteotoxic stress.
a, b Western blots for myofilament BAG3, HSP70, HSPB8, ubiquitin, and CHIP in neonatal rat ventricular myocytes (NRVMs) treated with vehicle (Dimethyl sulfoxide—DMSO) or the proteasome inhibitor MG132; images are representative of 3 independent experiments. cg Quantification of myofilament protein expression normalized to total protein for BAG3 (c), HSP70 (d), HSPB8 (e), CHIP (f), and ubiquitin (g); n = 6 DMSO, 6 MG132 from 3 independent experiments; two-tailed t-test. All data are presented as mean ± SEM. h–k Immunofluorescence images for NRVMs treated with DMSO (h) or MG132 (j) immunostained for BAG3 and α-actinin, with quantitative line scan of fluorescence intensity (i, k); ×63 magnification, scale bars = 10 µm; images are representative of 5 cells/treatment/3 independent experiments.
Fig. 5
Fig. 5. BAG3 is required for full assembly of CASA complex members in the myofilament fraction.
a Western blots for myofilament BAG3, HSP70, HSPB8, and CHIP in WT, BAG3+/−, and BAG3−/− mice; images are representative of 6 WT hearts, 7 BAG3+/− hearts, and 3 BAG3−/− hearts. bd Densitometry signal of HSP70 (b), HSPB8 (c), and CHIP (d) normalized to total protein; n = 6 WT, 7 BAG3+/−, 3 BAG3−/−; one-way ANOVA, Tukey post-hoc. e Western blot for myofilament HSP70 in DCM and NF human samples; image is representative of 9 NF hearts and 21 DCM hearts. f HSP70 expression grouped by “high” or “low” BAG3 expression; n = 18 high BAG3, 12 low BAG3. g Western blot for myofilament HSPB8 in NF and DCM human samples; image is representative of 9 NF hearts and 21 DCM hearts. h HSPB8 expression grouped by “high” or “low” BAG3 expression; n = 18 high BAG3, 12 low BAG3. i Western blot for myofilament CHIP in DCM and NF human samples; image is representative of and 9 NF and 17 DCM hearts. j CHIP expression grouped by “high” or “low” BAG3 expression; n = 15 high BAG3, 11 low BAG3 (4 samples not assessed due to lack of remaining tissue). High ≥80% of mean NF expression, Low <80% mean NF expression; two-tailed t-test. All data are presented as mean ± SEM.
Fig. 6
Fig. 6. Identification of the sarcomeric CASA clients in the human heart.
a Quantitative Venn diagram of the BAG3, HSP70, and HSPB8 myofilament interactomes identified by bottom-up mass spectrometry of immunoprecipitated proteins. b List of the 49 shared proteins identified in the myofilament interactome of each CASA complex member; bold = previously identified CASA clients (FLNC) and new CASA clients identified in this study. c Western blot for myofilament ubiquitin and ubiquitinated proteins released from the myofilament in response to increased BAG3 expression; image is representative of 3 hearts/group. d, e Quantitative densitometry for myofilament (d) and released (e) ubiquitin normalized to α-actin; n = 3 control, 3 + BAG3. fm Spectral count analysis of the eight sarcomere proteins identified by mass spectrometry to increase in the released protein fraction with increased BAG3 expression. For all, n = 3 control and 3 recombinant BAG3 treatment (+BAG3), from the same 3 human LV samples. All data are presented as mean ± SEM and were analyzed by two-tailed t-test.
Fig. 7
Fig. 7. Increasing BAG3 expression in heart failure restores myofilament function and sarcomeric CASA turnover.
a Skinned myocyte force-calcium relationship for mouse cardiomyocytes from sham, heart failure (HF), and HF treated with AAV9-BAG3 (HF/BAG3); n = 12 sham from 4 mice, 9 HF from 3 mice, and 9 HF/BAG3 from 3 mice. b, c Summary data for myocyte Fmax (b) and EC50 (c) corresponding to the force-calcium curves in a. d Western blot for myofilament BAG3, myc-BAG3, HSP70, and HSPB8 in the sham, HF, and HF/BAG3 mice; images are representative of 6 sham hearts, 5 HF hearts, and 4 HF/BAG3 hearts. eh BAG3, myc, HSP70, and HSPB8 protein expression normalized to total protein. i Western blot for myofilament P62 and CHIP in the sham, HF, and HF/BAG3 mice; images are representative of 6 sham hearts, 5 HF hearts, and 4 HF/BAG3 hearts. j, k P62 and CHIP protein expression normalized to total protein. l Western blot for myofilament ubiquitin in the sham, HF, and HF/BAG3 mice; images are representative of 6 sham hearts, 5 HF hearts, and 4 HF/BAG3 hearts. m Myofilament ubiquitin normalized to total protein. For all western blots: n = 6 sham, 5 HF, 4 HF/BAG3. All data are presented as mean ± SEM and were analyzed via one-way ANOVA with Tukey post-hoc test for multiple comparisons.

Similar articles

Cited by

References

    1. Dassanayaka, S. & Jones, S. P. Recent developments in heart failure. Circ. Res. 117, e58–e63 (2015). - PMC - PubMed
    1. Luo, M. & Anderson, M. E. Mechanisms of altered Ca2+ handling in heart failure. Circ. Res. 113, 690–708 (2013). - PMC - PubMed
    1. Hamdani N, et al. Sarcomeric dysfunction in heart failure. Cardiovasc. Res. 2008;77:649–658. doi: 10.1093/cvr/cvm079. - DOI - PubMed
    1. Hartupee, J. & Mann, D. L. Neurohormonal activation in heart failure with reduced ejection fraction. Nat. Rev. Cardiol.14, 30–38 (2016). - PMC - PubMed
    1. Hanft, L. M., Emter, C. A. & McDonald, K. S. Cardiac myofibrillar contractile properties during the progression from hypertension to decompensated heart failure. Am. J. Physiol. Hear. Circ. Physiol. 313, H103–H113 (2017). - PMC - PubMed

Publication types

MeSH terms