. 2021 May 18;11(1):10538.
doi: 10.1038/s41598-021-90009-9.

Regeneration linked miRNA modify tumor phenotype and can enforce multi-lineage growth arrest in vivo

Affiliations

Regeneration linked miRNA modify tumor phenotype and can enforce multi-lineage growth arrest in vivo

Siamak Salehi et al. Sci Rep. .

Abstract

Regulated cell proliferation is an effector mechanism of regeneration, whilst dysregulated cell proliferation is a feature of cancer. We have previously identified microRNA (miRNA) that regulate successful and failed human liver regeneration. We hypothesized that these regulators may directly modify tumor behavior. Here we show that inhibition of miRNAs -503 and -23a, alone or in combination, enhances tumor proliferation in hepatocyte and non-hepatocyte derived cancers in vitro, driving more aggressive tumor behavior in vivo. Inhibition of miRNA-152 caused induction of DNMT1, site-specific methylation with associated changes in gene expression and in vitro and in vivo growth inhibition. Enforced changes in expression of two miRNA recapitulating changes observed in failed regeneration led to complete growth inhibition of multi-lineage cancers in vivo. Our results indicate that regulation of regeneration and tumor aggressiveness are concordant and that miRNA-based inhibitors of regeneration may constitute a novel treatment strategy for human cancers.


Conflict of interest statement

The authors declare no competing interests.

Figures
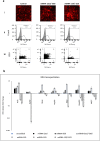
Figure 1
Figure 1
EDU incorporation. (a) Expression of miRNA-23ai/-503i and miRNA-150/-152i in HepG2 cancer cell lines under selection pressure. (i): Fluorescence images of samples transduced with scrambled, miRNA-23ai/-503i and miRNA-150/-152i. (ii): Flow cytometry profiles showing transduced HepG2 cells compared to un-transduced cells. All constructs co-expressed MCherry; bar represents the proportion of positively transduced cells. (iii): Flow cytometry dot plots showing EdU incorporation in HepG2 cells transfected with scrambled, miRNA-23ai/-503i and miRNA-150/-152i. (b) EdU uptake and fold change in Hela, HUH7, Min6, HepG2, RKO, HepaRG and MCF7 cell lines transduced with scrambled, miRNA-23ai, miRNA-503i, miRNA-23ai/-503i, miRNA-150, miRNA-152i and miRNA-150/-152i. The fold change of EDU + /M-Cherry + cells in each cell line are compared against scrambled control vector. Results are representative of three independent experiments. Error bars indicate SD. *p < 0.05,** p < 0.01, ***p < 0.001.
Figure 2
Figure 2
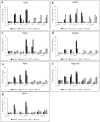
qPCR analysis of regulators of cell proliferation: MCM-2, Cyclin D1, p21 and Prox1. RNA templates were made from (a) Hela, (b) HUH7, (c) Min6, (d) HepG2, (e) RKO, (f) HepaRG and (g) MCF7 cells transfected with scrambled, miRNA-23i, miRNA-503i, miRNA-23ai/-503i, miRNA-150, miRNA-152i and miRNA-150/-152i. All expression levels were normalized to scrambled control vector. qPCR data in all cases are representative of three different experiments. Error bars indicate SD.
Figure 3
Figure 3
Growth kinetics. Tumor volume (ml) and weight (mg) measurement: tumor volume calculated from the recorded successive tumors in regular intervals using calipers to measure the longest and shortest tumor diameters (volume measurement formula explained in “Materials and methods”). Xenograft Tumor weights measured in nude mice at the end of experiments. (i): HepG2 Tumor Volume (ii): RKO tumor volume (iii): HepG2 tumor weight (iv): RKO tumor weight. Data is representative of three different experiments. *p ≤ 0.05; **p ≤ 0.01; ***p ≤ 0.001; p-values are relative to scrambled vector; SE = standard error.
Figure 4
Figure 4
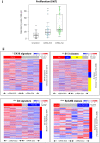
Ki67 proliferation index in xenograft tumors generated with miRNA constructs and comparison of cancer signature between these tumors and HCC cancer panels (i): Ki-67 expression ratio: Ki-67 positive cells per 100 cells obtained from tumor tissues transduced with scrambled control vector, miRNA-503i and miRNA-23ai. (ii): Comparing cancer signature between tumors developed in mice transduced with either miRNA-503i or miRNA-23ai using NTP method with FDR < 0.05 looking at known indicators of HCC. *CK-19: (cytokeratin-19). **S1–S3: (three robust HCC subclasses (termed S1, S2, and S3), each correlated with clinical parameters such as tumor size, extent of cellular differentiation, and serum alpha-fetoprotein levels. An analysis of the components of the signatures indicated that S1 reflected aberrant activation of the WNT signaling pathway, S2 was characterized by proliferation as well as MYC and AKT activation, and S3 was associated with hepatocyte differentiation. ***EpCAM: (epithelial cellular adhesion molecule). ****G3: (Glypican 3). VNTP method: Nearest-Template Prediction method (NTP, extensively reviewed, Hoshida Y. 2010).
Figure 5
Figure 5
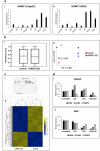
DNMT1 expression in HepG2 and RKO cells transfected with miRNA constructs, methylation and gene expression arrays in miRNA-152i generated xenograft tumors and expression of genes associated with cell proliferation and cancer in HepG2 and RKO cells transfected with miRNA constructs. (a) qPCR analysis of DNMT1 expression. (i) HepG2 and (ii) RKO cells transfected with miRNA constructs. Kidney RNA used as a positive control. All expression levels were normalized to scrambled control vector. qPCR data in all cases are representative of three different experiments. Error bars indicate SD. *p < 0.05, **p  < 0.01, ***p < 0.001. (b) Analysis of the total CpG methylation in cells transduced with scrambled control vector and miRNA-152i. The datasets are equivalent, overlapping and not skewed (3% difference); (i): box and whisker plot, (ii) principle component analysis (PCA) of the degree of methylation at each CpG in the two datasets shows samples group by condition. (c) Gene expression analysis using Affymetrix gene2 array: RNA extracted from xenograft tumors transduced with scrambled or miRNA-152i. (i) PCA shows complete segregation of 2 groups indicating differentially expressed genes within each group, (ii)The dendrogram shown above heatmap demonstrates similarities and differences between samples by miRNA expression (Affymetrix GeneChipm Command Console (AGCC) 4.0, http://www.affymetrix.com/support/technical/byproduct.affx?product=commandconsole). (d) qPCR analysis of SNRPN, WNK3, and FAM3B genes. (i) HepG2 and (ii) RKO) cells transfected with scrambled, miRNA-150, miRNA-152i and miRNA-150/-152i. All expression levels were normalized to scrambled control vector. qPCR data in all cases are representative of three different experiments. Error bars indicate SD. *p < 0.05, **p < 0.01, ***p < 0.001.

Similar articles

References

    1. Bangrua S, Kalsotraa A. Cellular and molecular basis of liver regeneration. Semin. Cell Dev. Biol. 2020;100:74–87. doi: 10.1016/j.semcdb.2019.12.004. - DOI - PMC - PubMed
    1. Ritschka B, et al. The senotherapeutic drug ABT-737 disrupts aberrant p21 expression to restore liver regeneration in adult mice. Genes Dev. 2020;34:489–494. doi: 10.1101/gad.332643.119. - DOI - PMC - PubMed
    1. Birch J, Gil J. Blunting senescence boosts liver regeneration. Genes Dev. 2020;34:463–464. doi: 10.1101/gad.337394.120. - DOI - PMC - PubMed
    1. Forbes S, Raven A. Hepatic progenitors in liver regeneration. J. Hepatol. 2018;69:1394–1395. doi: 10.1016/j.jhep.2018.03.004. - DOI - PubMed
    1. Wang B, et al. Brg1 promotes liver regeneration after partial hepatectomy via regulation of cell cycle. Sci. Rep. 2019;9:2320. doi: 10.1038/s41598-019-38568-w. - DOI - PMC - PubMed

Publication types

LinkOut - more resources