

The genetic architecture of the human thalamus and its overlap with ten common brain disorders
- PMID: 34006833
- PMCID: PMC8131358
- DOI: 10.1038/s41467-021-23175-z
The genetic architecture of the human thalamus and its overlap with ten common brain disorders
Abstract
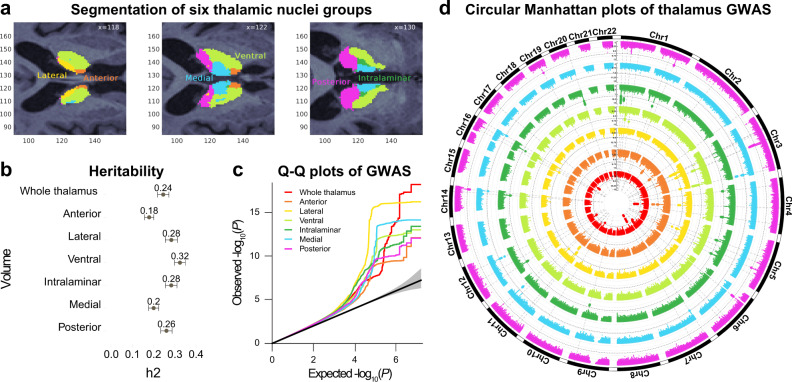
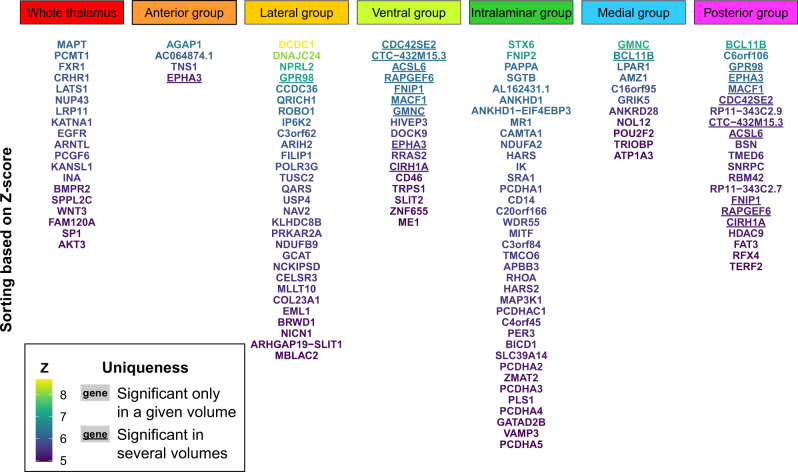
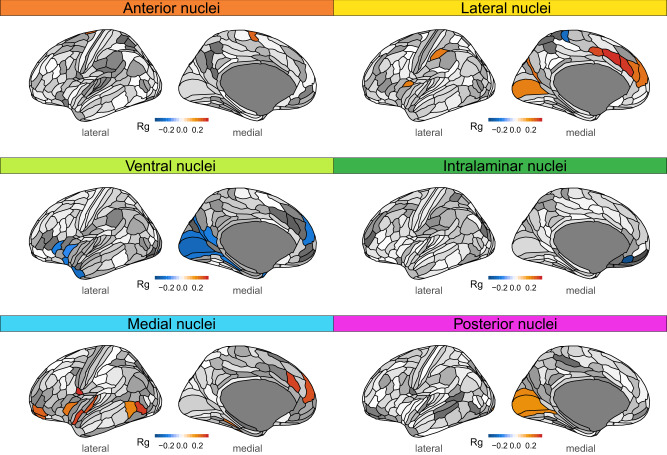
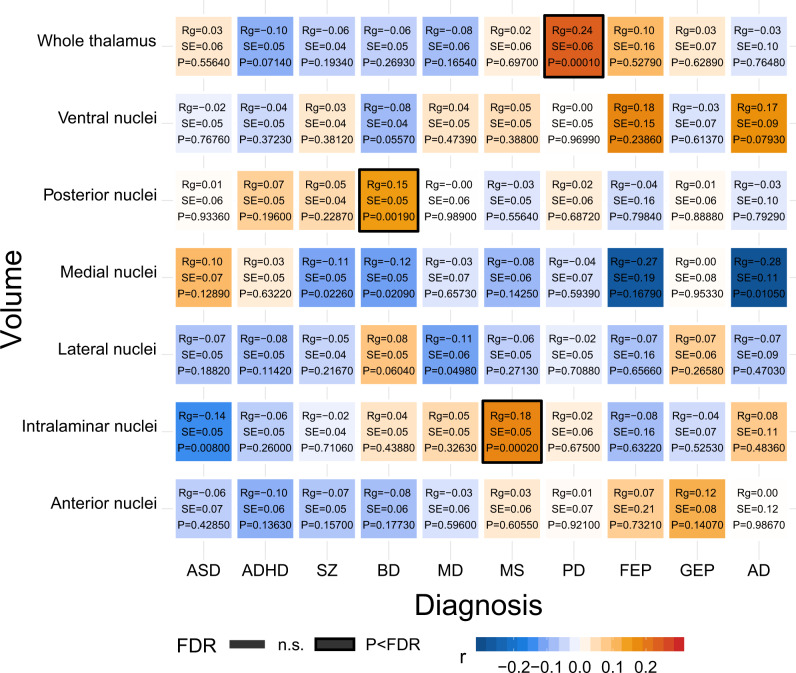
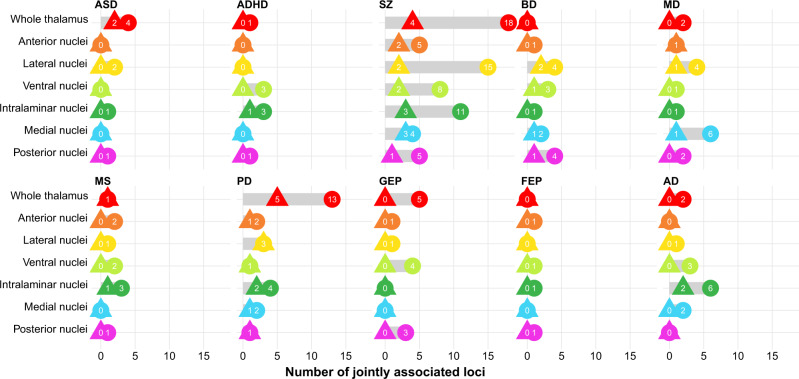
The thalamus is a vital communication hub in the center of the brain and consists of distinct nuclei critical for consciousness and higher-order cortical functions. Structural and functional thalamic alterations are involved in the pathogenesis of common brain disorders, yet the genetic architecture of the thalamus remains largely unknown. Here, using brain scans and genotype data from 30,114 individuals, we identify 55 lead single nucleotide polymorphisms (SNPs) within 42 genetic loci and 391 genes associated with volumes of the thalamus and its nuclei. In an independent validation sample (n = 5173) 53 out of the 55 lead SNPs of the discovery sample show the same effect direction (sign test, P = 8.6e-14). We map the genetic relationship between thalamic nuclei and 180 cerebral cortical areas and find overlapping genetic architectures consistent with thalamocortical connectivity. Pleiotropy analyses between thalamic volumes and ten psychiatric and neurological disorders reveal shared variants for all disorders. Together, these analyses identify genetic loci linked to thalamic nuclei and substantiate the emerging view of the thalamus having central roles in cortical functioning and common brain disorders.
Conflict of interest statement
T.E. is a consultant to BrainWaveBank and received speaker’s honoraria from Lundbeck and Janssen Cilag. O.A.A. is a consultant to BrainWaveBank and HealthLytix, and received speaker’s honoraria from Lundbeck. The remaining authors declare no competing interests.
Figures
Similar articles
-
The genetic architecture of human brainstem structures and their involvement in common brain disorders.Nat Commun. 2020 Aug 11;11(1):4016. doi: 10.1038/s41467-020-17376-1. Nat Commun. 2020. PMID: 32782260 Free PMC article.
-
Organization of thalamocortical structural covariance and a corresponding 3D atlas of the mouse thalamus.Neuroimage. 2024 Jan;285:120453. doi: 10.1016/j.neuroimage.2023.120453. Epub 2023 Nov 17. Neuroimage. 2024. PMID: 37979895
-
Generation of human thalamus atlases from 7 T data and application to intrathalamic nuclei segmentation in clinical 3 T T1-weighted images.Magn Reson Imaging. 2020 Jan;65:114-128. doi: 10.1016/j.mri.2019.09.004. Epub 2019 Oct 16. Magn Reson Imaging. 2020. PMID: 31629074
-
Review of thalamocortical resting-state fMRI studies in schizophrenia.Schizophr Res. 2017 Feb;180:58-63. doi: 10.1016/j.schres.2016.08.005. Epub 2016 Aug 13. Schizophr Res. 2017. PMID: 27531067 Free PMC article. Review.
-
Thalamocortical network: a core structure for integrative multimodal vestibular functions.Curr Opin Neurol. 2019 Feb;32(1):154-164. doi: 10.1097/WCO.0000000000000638. Curr Opin Neurol. 2019. PMID: 30461462 Review.
Cited by
-
Investigating the shared genetic architecture between depression and subcortical volumes.Nat Commun. 2024 Sep 2;15(1):7647. doi: 10.1038/s41467-024-52121-y. Nat Commun. 2024. PMID: 39223129 Free PMC article.
-
Diencephalic organoids - A key to unraveling development, connectivity, and pathology of the human diencephalon.Front Cell Neurosci. 2023 Dec 7;17:1308479. doi: 10.3389/fncel.2023.1308479. eCollection 2023. Front Cell Neurosci. 2023. PMID: 38130869 Free PMC article. Review.
-
Bench Research Informed by GWAS Results.Cells. 2021 Nov 15;10(11):3184. doi: 10.3390/cells10113184. Cells. 2021. PMID: 34831407 Free PMC article. Review.
-
Pleiotropy with sex-specific traits reveals genetic aspects of sex differences in Parkinson's disease.Brain. 2024 Mar 1;147(3):858-870. doi: 10.1093/brain/awad297. Brain. 2024. PMID: 37671566 Free PMC article.
-
The Longitudinal Relationship Between Brain Morphology and Obsessive-Compulsive Symptoms in Children From the General Population.JAACAP Open. 2023 Dec 25;2(2):126-134. doi: 10.1016/j.jaacop.2023.11.003. eCollection 2024 Jun. JAACAP Open. 2023. PMID: 39554206 Free PMC article.
References
Publication types
MeSH terms
LinkOut - more resources
Full Text Sources
Other Literature Sources
Medical
