Associations Among Adipose Tissue Immunology, Inflammation, Exosomes and Insulin Sensitivity in People With Obesity and Nonalcoholic Fatty Liver Disease
- PMID: 34004161
- PMCID: PMC8900214
- DOI: 10.1053/j.gastro.2021.05.008
Associations Among Adipose Tissue Immunology, Inflammation, Exosomes and Insulin Sensitivity in People With Obesity and Nonalcoholic Fatty Liver Disease
Abstract
Background and aims: Insulin resistance is a key factor in the pathogenesis of nonalcoholic fatty liver disease (NAFLD). We evaluated the importance of subcutaneous abdominal adipose tissue (SAAT) inflammation and both plasma and SAAT-derived exosomes in regulating insulin sensitivity in people with obesity and NAFLD.
Methods: Adipose tissue inflammation (macrophage and T-cell content and expression of proinflammatory cytokines), liver and whole-body insulin sensitivity (assessed using a hyperinsulinemic-euglycemic clamp and glucose tracer infusion), and 24-hour serial plasma cytokine concentrations were evaluated in 3 groups stratified by adiposity and intrahepatic triglyceride (IHTG) content: (1) lean with normal IHTG content (LEAN; N = 14); (2) obese with normal IHTG content (OB-NL; N = 28); and (3) obese with NAFLD (OB-NAFLD; N = 28). The effect of plasma and SAAT-derived exosomes on insulin-stimulated Akt phosphorylation in human skeletal muscle myotubes and mouse primary hepatocytes was assessed in a subset of participants.
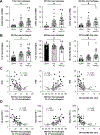
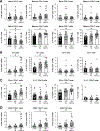
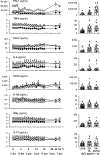
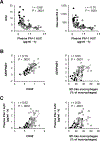
Results: Proinflammatory macrophages, proinflammatory CD4 and CD8 T-cell populations, and gene expression of several cytokines in SAAT were greater in the OB-NAFLD than the OB-NL and LEAN groups. However, with the exception of PAI-1, which was greater in the OB-NAFLD than the LEAN and OB-NL groups, 24-hour plasma cytokine concentration areas-under-the-curve were not different between groups. The percentage of proinflammatory macrophages and plasma PAI-1 concentration areas-under-the-curve were inversely correlated with both hepatic and whole-body insulin sensitivity. Compared with exosomes from OB-NL participants, plasma and SAAT-derived exosomes from the OB-NAFLD group decreased insulin signaling in myotubes and hepatocytes.
Conclusions: Systemic insulin resistance in people with obesity and NAFLD is associated with increased plasma PAI-1 concentrations and both plasma and SAAT-derived exosomes. ClinicalTrials.gov number: NCT02706262 (https://clinicaltrials.gov/ct2/show/NCT02706262).
Keywords: Cytokines; Insulin Resistance; Macrophages; PAI-1; T Cells.
Copyright © 2021 AGA Institute. Published by Elsevier Inc. All rights reserved.
Figures


Similar articles
-
Increased Adipose Tissue Fibrogenesis, Not Impaired Expandability, Is Associated With Nonalcoholic Fatty Liver Disease.Hepatology. 2021 Sep;74(3):1287-1299. doi: 10.1002/hep.31822. Epub 2021 Jun 22. Hepatology. 2021. PMID: 33743554 Free PMC article.
-
Influence of adiposity, insulin resistance, and intrahepatic triglyceride content on insulin kinetics.J Clin Invest. 2020 Jun 1;130(6):3305-3314. doi: 10.1172/JCI136756. J Clin Invest. 2020. PMID: 32191646 Free PMC article. Clinical Trial.
-
Insulin resistance drives hepatic de novo lipogenesis in nonalcoholic fatty liver disease.J Clin Invest. 2020 Mar 2;130(3):1453-1460. doi: 10.1172/JCI134165. J Clin Invest. 2020. PMID: 31805015 Free PMC article. Clinical Trial.
-
Non-alcoholic fatty liver disease and obesity: biochemical, metabolic and clinical presentations.World J Gastroenterol. 2014 Jul 28;20(28):9330-7. doi: 10.3748/wjg.v20.i28.9330. World J Gastroenterol. 2014. PMID: 25071327 Free PMC article. Review.
-
Hepatic Steatosis as a Marker of Metabolic Dysfunction.Nutrients. 2015 Jun 19;7(6):4995-5019. doi: 10.3390/nu7064995. Nutrients. 2015. PMID: 26102213 Free PMC article. Review.
Cited by
-
Adipose 'neighborhoods' collaborate to maintain metabolic health.Curr Opin Genet Dev. 2023 Aug;81:102079. doi: 10.1016/j.gde.2023.102079. Epub 2023 Jul 3. Curr Opin Genet Dev. 2023. PMID: 37406429 Free PMC article. Review.
-
Inflammation in obesity, diabetes, and related disorders.Immunity. 2022 Jan 11;55(1):31-55. doi: 10.1016/j.immuni.2021.12.013. Immunity. 2022. PMID: 35021057 Free PMC article. Review.
-
Proanthocyanidins-Based Synbiotics as a Novel Strategy for Nonalcoholic Fatty Liver Disease (NAFLD) Risk Reduction.Molecules. 2024 Feb 3;29(3):709. doi: 10.3390/molecules29030709. Molecules. 2024. PMID: 38338453 Free PMC article. Review.
-
Cellular Senescence in Obesity and Associated Complications: a New Therapeutic Target.Curr Diab Rep. 2022 Nov;22(11):537-548. doi: 10.1007/s11892-022-01493-w. Epub 2022 Oct 14. Curr Diab Rep. 2022. PMID: 36239841 Free PMC article. Review.
-
Transcriptomics reveal a molecular signature in the progression of nonalcoholic steatohepatitis and identifies PAI‑1 and MMP‑9 as biomarkers in in vivo and in vitro studies.Mol Med Rep. 2024 Jan;29(1):15. doi: 10.3892/mmr.2023.13138. Epub 2023 Dec 1. Mol Med Rep. 2024. PMID: 38038126 Free PMC article.
References
-
- Klein S, Wadden T, Sugerman HJ. AGA technical review on obesity. Gastroenterology 2002;123:882–932. - PubMed
-
- Stefan N, Haring HU, Cusi K. Non-alcoholic fatty liver disease: causes, diagnosis, cardiometabolic consequences, and treatment strategies. Lancet Diabetes Endocrinol 2019;7:313–324. - PubMed
-
- Belfort R, Harrison SA, Brown K, et al. A placebo-controlled trial of pioglitazone in subjects with nonalcoholic steatohepatitis. N Engl J Med 2006;355:2297–307. - PubMed
Publication types
MeSH terms
Substances
Associated data
Grants and funding
LinkOut - more resources
Full Text Sources
Other Literature Sources
Medical
Molecular Biology Databases
Research Materials
Miscellaneous

