

Detection of differentially abundant cell subpopulations in scRNA-seq data
- PMID: 34001664
- PMCID: PMC8179149
- DOI: 10.1073/pnas.2100293118
Detection of differentially abundant cell subpopulations in scRNA-seq data
Abstract
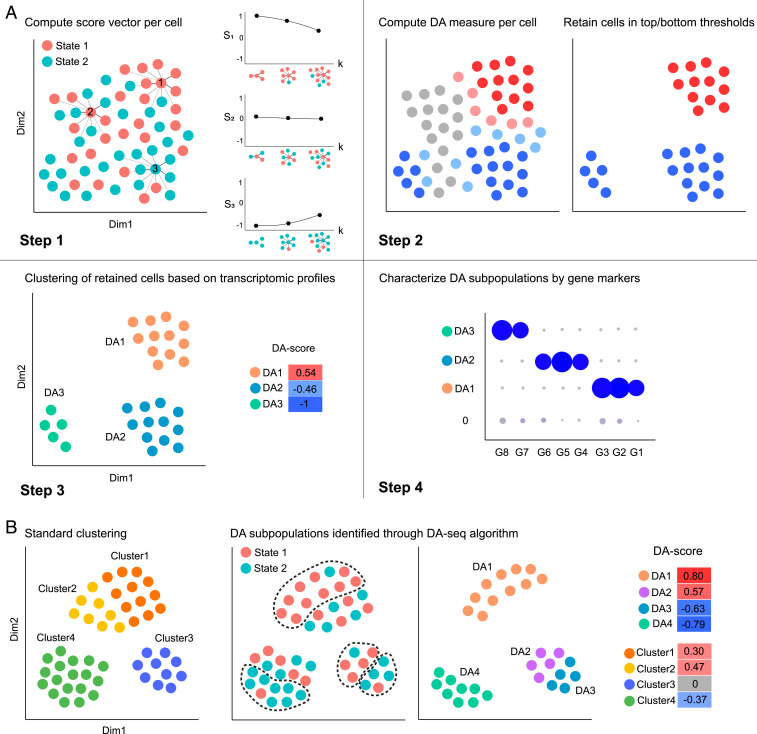
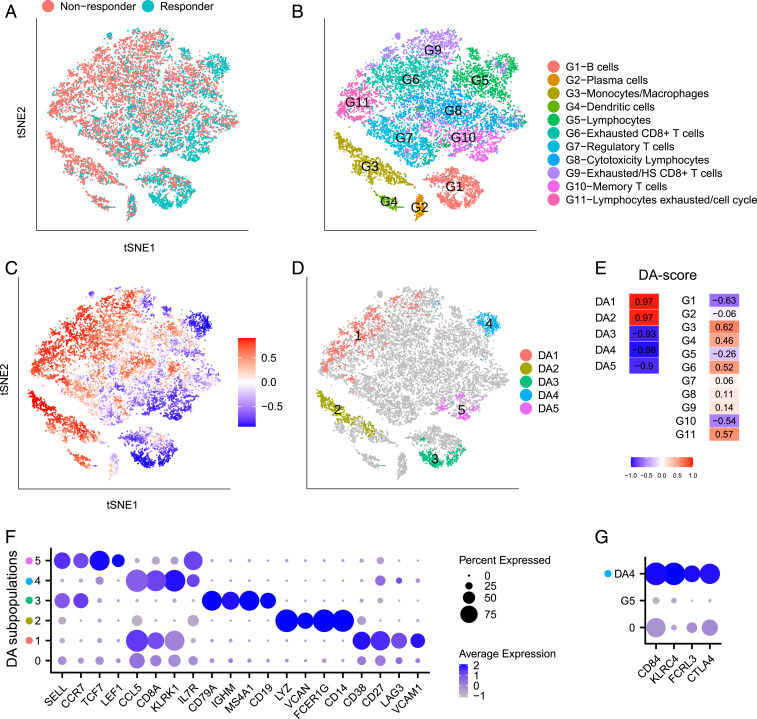
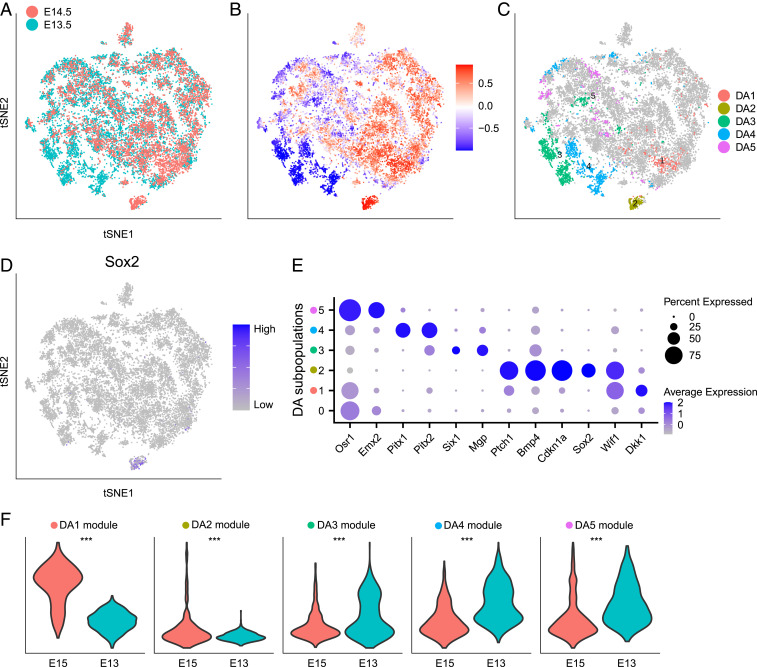
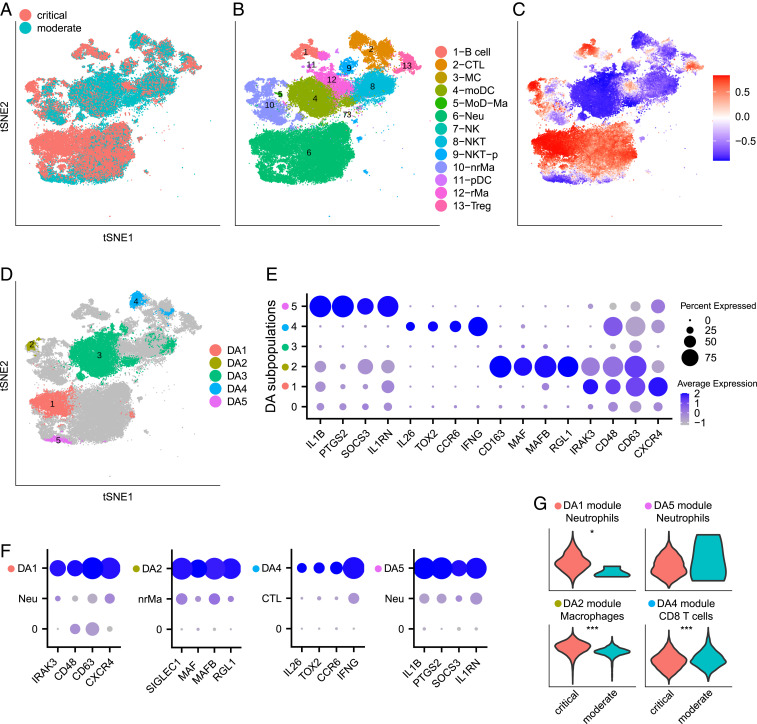
Comprehensive and accurate comparisons of transcriptomic distributions of cells from samples taken from two different biological states, such as healthy versus diseased individuals, are an emerging challenge in single-cell RNA sequencing (scRNA-seq) analysis. Current methods for detecting differentially abundant (DA) subpopulations between samples rely heavily on initial clustering of all cells in both samples. Often, this clustering step is inadequate since the DA subpopulations may not align with a clear cluster structure, and important differences between the two biological states can be missed. Here, we introduce DA-seq, a targeted approach for identifying DA subpopulations not restricted to clusters. DA-seq is a multiscale method that quantifies a local DA measure for each cell, which is computed from its k nearest neighboring cells across a range of k values. Based on this measure, DA-seq delineates contiguous significant DA subpopulations in the transcriptomic space. We apply DA-seq to several scRNA-seq datasets and highlight its improved ability to detect differences between distinct phenotypes in severe versus mildly ill COVID-19 patients, melanomas subjected to immune checkpoint therapy comparing responders to nonresponders, embryonic development at two time points, and young versus aging brain tissue. DA-seq enabled us to detect differences between these phenotypes. Importantly, we find that DA-seq not only recovers the DA cell types as discovered in the original studies but also reveals additional DA subpopulations that were not described before. Analysis of these subpopulations yields biological insights that would otherwise be undetected using conventional computational approaches.
Keywords: RNA-seq; local differential abundance; single cell.
Conflict of interest statement
The authors declare no competing interest.
Figures
Similar articles
-
IDEAS: individual level differential expression analysis for single-cell RNA-seq data.Genome Biol. 2022 Jan 24;23(1):33. doi: 10.1186/s13059-022-02605-1. Genome Biol. 2022. PMID: 35073995 Free PMC article.
-
Single-cell RNA sequencing to explore immune cell heterogeneity.Nat Rev Immunol. 2018 Jan;18(1):35-45. doi: 10.1038/nri.2017.76. Epub 2017 Aug 7. Nat Rev Immunol. 2018. PMID: 28787399 Review.
-
Integrating single-cell sequencing data with GWAS summary statistics reveals CD16+monocytes and memory CD8+T cells involved in severe COVID-19.Genome Med. 2022 Feb 17;14(1):16. doi: 10.1186/s13073-022-01021-1. Genome Med. 2022. PMID: 35172892 Free PMC article.
-
SuperCT: a supervised-learning framework for enhanced characterization of single-cell transcriptomic profiles.Nucleic Acids Res. 2019 May 7;47(8):e48. doi: 10.1093/nar/gkz116. Nucleic Acids Res. 2019. PMID: 30799483 Free PMC article.
-
Identifying cell types to interpret scRNA-seq data: how, why and more possibilities.Brief Funct Genomics. 2020 Jul 29;19(4):286-291. doi: 10.1093/bfgp/elaa003. Brief Funct Genomics. 2020. PMID: 32232401 Review.
Cited by
-
Trajectory inference across multiple conditions with condiments.Nat Commun. 2024 Jan 27;15(1):833. doi: 10.1038/s41467-024-44823-0. Nat Commun. 2024. PMID: 38280860 Free PMC article.
-
Inflammasome activation in infected macrophages drives COVID-19 pathology.Nature. 2022 Jun;606(7914):585-593. doi: 10.1038/s41586-022-04802-1. Epub 2022 Apr 28. Nature. 2022. PMID: 35483404 Free PMC article.
-
Benchmarking differential abundance methods for finding condition-specific prototypical cells in multi-sample single-cell datasets.Genome Biol. 2024 Jan 3;25(1):9. doi: 10.1186/s13059-023-03143-0. Genome Biol. 2024. PMID: 38172966 Free PMC article.
-
Polony gels enable amplifiable DNA stamping and spatial transcriptomics of chronic pain.Cell. 2022 Nov 23;185(24):4621-4633.e17. doi: 10.1016/j.cell.2022.10.021. Epub 2022 Nov 10. Cell. 2022. PMID: 36368323 Free PMC article.
-
Short-Term Treatment with Rho-Associated Kinase Inhibitor Preserves Keratinocyte Stem Cell Characteristics In Vitro.Cells. 2023 Jan 17;12(3):346. doi: 10.3390/cells12030346. Cells. 2023. PMID: 36766688 Free PMC article.
References
-
- Chua R. L., et al. , Covid-19 severity correlates with airway epithelium–immune cell interactions identified by single-cell analysis. Nat. Biotechnol. 38, 970–979 (2020). - PubMed
Publication types
MeSH terms
Substances
Grants and funding
LinkOut - more resources
Full Text Sources
Other Literature Sources
Medical
