Cork-in-bottle mechanism of inhibitor binding to mammalian complex I
- PMID: 33990335
- PMCID: PMC8121435
- DOI: 10.1126/sciadv.abg4000
Cork-in-bottle mechanism of inhibitor binding to mammalian complex I
Abstract
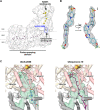
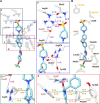
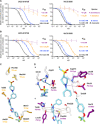
Mitochondrial complex I (NADH:ubiquinone oxidoreductase), a major contributor of free energy for oxidative phosphorylation, is increasingly recognized as a promising drug target for ischemia-reperfusion injury, metabolic disorders, and various cancers. Several pharmacologically relevant but structurally unrelated small molecules have been identified as specific complex I inhibitors, but their modes of action remain unclear. Here, we present a 3.0-Å resolution cryo-electron microscopy structure of mammalian complex I inhibited by a derivative of IACS-010759, which is currently in clinical development against cancers reliant on oxidative phosphorylation, revealing its unique cork-in-bottle mechanism of inhibition. We combine structural and kinetic analyses to deconvolute cross-species differences in inhibition and identify the structural motif of a "chain" of aromatic rings as a characteristic that promotes inhibition. Our findings provide insights into the importance of π-stacking residues for inhibitor binding in the long substrate-binding channel in complex I and a guide for future biorational drug design.
Copyright © 2021 The Authors, some rights reserved; exclusive licensee American Association for the Advancement of Science. No claim to original U.S. Government Works. Distributed under a Creative Commons Attribution License 4.0 (CC BY).
Figures


Similar articles
-
Structure of inhibitor-bound mammalian complex I.Nat Commun. 2020 Oct 16;11(1):5261. doi: 10.1038/s41467-020-18950-3. Nat Commun. 2020. PMID: 33067417 Free PMC article.
-
Structure of the Deactive State of Mammalian Respiratory Complex I.Structure. 2018 Feb 6;26(2):312-319.e3. doi: 10.1016/j.str.2017.12.014. Epub 2018 Jan 26. Structure. 2018. PMID: 29395787 Free PMC article.
-
Ubiquinone Binding and Reduction by Complex I-Open Questions and Mechanistic Implications.Front Chem. 2021 Apr 30;9:672851. doi: 10.3389/fchem.2021.672851. eCollection 2021. Front Chem. 2021. PMID: 33996767 Free PMC article. Review.
-
Mammalian Respiratory Complex I Through the Lens of Cryo-EM.Annu Rev Biophys. 2019 May 6;48:165-184. doi: 10.1146/annurev-biophys-052118-115704. Epub 2019 Feb 20. Annu Rev Biophys. 2019. PMID: 30786232 Review.
-
Correlating kinetic and structural data on ubiquinone binding and reduction by respiratory complex I.Proc Natl Acad Sci U S A. 2017 Nov 28;114(48):12737-12742. doi: 10.1073/pnas.1714074114. Epub 2017 Nov 13. Proc Natl Acad Sci U S A. 2017. PMID: 29133414 Free PMC article.
Cited by
-
Binding of Natural Inhibitors to Respiratory Complex I.Pharmaceuticals (Basel). 2022 Aug 31;15(9):1088. doi: 10.3390/ph15091088. Pharmaceuticals (Basel). 2022. PMID: 36145309 Free PMC article. Review.
-
Structural basis of mammalian respiratory complex I inhibition by medicinal biguanides.Science. 2023 Jan 27;379(6630):351-357. doi: 10.1126/science.ade3332. Epub 2023 Jan 26. Science. 2023. PMID: 36701435 Free PMC article.
-
Reverse Electron Transfer by Respiratory Complex I Catalyzed in a Modular Proteoliposome System.J Am Chem Soc. 2022 Apr 20;144(15):6791-6801. doi: 10.1021/jacs.2c00274. Epub 2022 Apr 5. J Am Chem Soc. 2022. PMID: 35380814 Free PMC article.
-
PDIA2 Bridges Endoplasmic Reticulum Stress and Metabolic Reprogramming During Malignant Transformation of Chronic Colitis.Front Oncol. 2022 Jul 4;12:836087. doi: 10.3389/fonc.2022.836087. eCollection 2022. Front Oncol. 2022. PMID: 35860571 Free PMC article.
-
Respiratory complex I with charge symmetry in the membrane arm pumps protons.Proc Natl Acad Sci U S A. 2022 Jul 5;119(27):e2123090119. doi: 10.1073/pnas.2123090119. Epub 2022 Jun 27. Proc Natl Acad Sci U S A. 2022. PMID: 35759670 Free PMC article.
References
-
- Hirst J., Mitochondrial complex I. Annu. Rev. Biochem. 82, 551–575 (2013). - PubMed
-
- Parey K., Wirth C., Vonck J., Zickermann V., Respiratory complex I — Structure, mechanism and evolution. Curr. Opin. Struct. Biol. 63, 1–9 (2020). - PubMed
-
- Murphy M. P., Hartley R. C., Mitochondria as a therapeutic target for common pathologies. Nat. Rev. Drug Discov. 17, 865–886 (2018). - PubMed
-
- Ashton T. M., Gillies McKenna W., Kunz-Schughart L. A., Higgins G. S., Oxidative phosphorylation as an emerging target in cancer therapy. Clin. Cancer Res. 24, 2482–2490 (2018). - PubMed
-
- Brand M. D., Goncalves R. L. S., Orr A. L., Vargas L., Gerencser A. A., Borch Jensen M., Wang Y. T., Melov S., Turk C. N., Matzen J. T., Dardov V. J., Petrassi H. M., Meeusen S. L., Perevoshchikova I. V., Jasper H., Brookes P. S., Ainscow E. K., Suppressors of superoxide-H2O2 production at site IQ of mitochondrial complex I protect against stem cell hyperplasia and ischemia-reperfusion injury. Cell Metab. 24, 582–592 (2016). - PMC - PubMed
Publication types
Grants and funding
LinkOut - more resources
Full Text Sources
Other Literature Sources
Molecular Biology Databases
Research Materials
Miscellaneous

