. 2021 Jul 29;31(9):4259-4273.
doi: 10.1093/cercor/bhab084.

A Distinct Population of L6 Neurons in Mouse V1 Mediate Cross-Callosal Communication

Affiliations

A Distinct Population of L6 Neurons in Mouse V1 Mediate Cross-Callosal Communication

Yajie Liang et al. Cereb Cortex. .

Abstract

Through the corpus callosum, interhemispheric communication is mediated by callosal projection (CP) neurons. Using retrograde labeling, we identified a population of layer 6 (L6) excitatory neurons as the main conveyer of transcallosal information in the monocular zone of the mouse primary visual cortex (V1). Distinct from L6 corticothalamic (CT) population, V1 L6 CP neurons contribute to an extensive reciprocal network across multiple sensory cortices over two hemispheres. Receiving both local and long-range cortical inputs, they encode orientation, direction, and receptive field information, while are also highly spontaneous active. The spontaneous activity of L6 CP neurons exhibits complex relationships with brain states and stimulus presentation, distinct from the spontaneous activity patterns of the CT population. The anatomical and functional properties of these L6 CP neurons enable them to broadcast visual and nonvisual information across two hemispheres, and thus may play a role in regulating and coordinating brain-wide activity events.

Keywords: callosal projection neurons; corpus callosum; corticothalamic neurons; layer 6; visual cortex.


Figures

Figure 1
Figure 1
A distinct population of CP neurons in L6 of the mouse monocular V1. (A,B) Fluorescence images of left V1 after rAAV2-retro.CAG.GFP injection in contralateral (CONTRA) V1 with L5 pyramidal neurons labeled with H2B-mCherry (A; Rbp4-Cre × R26 LSL H2B mCherry) and L6 CT neurons labeled with tdTomato (B; NTSR1-Cre × Ai14), respectively. (C) Magnified and orthogonal views of the yellow box area in (B) (CP in green, CT in red). (D) Depth distributions of 515 CT and 80 CP somata measured by cell counting from the volume in (C). (E) Ratio of cell counts (CT vs. CP) from the nine FOVs, n = 4 mice (1–2 FOVs from each mouse, 4718 CT and 611 CP neurons). (F) Average cell size comparison between CP and CT neurons in the same FOVs. 4440 CT and 802 CP neurons in the nine FOVs from four mice. Wilcoxon signed-rank test, P = 0.0078. (G) Contralateral injection of rAAV2-retro.syn.Cre and ipsilateral injection of AAV2/1.syn.FLEX.GCaMP6s labeled CP neurons (left panel) in ipsilateral (IPSI) V1 and their axons in contralateral V1 (right panel). Axon image is taken after immunostaining with anti-GFP antibody. Dashed lines: (A,G) V1/V2 borders and cortical layers. Scale bar: 500 μm in (A,B); 50 μm in (C); 200 μm in (G).
Figure 2
Figure 2
Presynaptic partners of V1 L6 CP neurons from the ipsilateral hemisphere. (A) Schematic showing the experimental procedure. Starter cells were double-labeled by BFP and mCherry. mCherry+-only labeling indicated presynaptic partners of starter neurons. (B,C) Example fluorescence images of coronal brain sections with L4 pyramidal neurons as starter cells (B) and their presynaptic neurons ipsilateral to the injection site (C). (D,E) Fractions of local (D; within V1) and long-range (E) presynaptic neurons of L4 pyramidal neurons. (F,G) Example fluorescence images of coronal brain sections with CP neurons as starter cells (F) and their presynaptic neurons ipsilateral to the injection site (G). (H,I) Fractions of local (H) and long-range (I) presynaptic neurons of L6 CP neurons. (J,K) Example fluorescence images of coronal brain sections with CT neurons as starter cells (J) and their presynaptic neurons ipsilateral to the injection site (K). (L,M) Fractions of local (L) and long-range (M) presynaptic neurons of L6 CT neurons. Arrows in insets of (C,G,K) point to presynaptic cells in dLGN. Scale bars: 200 μm in (B,F,J) and insets of (C,G,K); 500 μm in (C,G,K).
Figure 3
Figure 3
In vivo calcium imaging of L6 CT and CP neurons in V1 of the awake mouse. (A) Schematic of in vivo imaging and visual stimulation setup. (B,D) Viral labeling strategies and widefield fluorescence images of coronal sections containing GCaMP6s+ L6 CT (B) and CP (D) neurons. Insets: dLGN. (C,E) Example in vivo two-photon excitation fluorescence images of L6 CT (C) and CP (E) neurons, with orientation-selective (OS) neurons color-coded by their preferred grating stimuli. (F,G) (Left) Example drifting-grating-evoked calcium responses from two OS CT (F) and CP (G) neurons (i and ii, labeled in C and E). Colored lines and gray shades: average and s.d. from 10 trials. (Right) Polar plots of calcium responses and fitted turning curves. (H–O) Histogram distributions of orientation and direction tuning parameters for CT (blue) and CP (red) neurons, including OSI (H), gOSI (I), turning curve FWHMs of OS neurons (J), preferred orientations of OS neurons (K), DSI (L) and gDSI (M) of OS neurons, FWHM of DS neurons (N), and preferred directions for DS neurons (O). Dashed lines: medians. Wilcoxon rank-sum test: ***P < 0.001. Scale bars: 600 μm in (B,D); 100 μm in (C,E).
Figure 4
Figure 4
V1 L6 CP neurons exhibit pervasive spontaneous activity. (A) Percentages of active CP and CT neurons with spontaneous activity, drifting-grating-evoked OS, and drifting-grating-evoked NOS responses, respectively, during grating stimulation. (B) Percentages of spontaneously active neurons in the dark. (C) Histogram distributions of mean ∆F/F% of spontaneously active CP (red) and CT (blue) neurons in the dark. (D) Raster plots of calcium transients (ΔF/F%) for CP and CT neurons with spontaneous activity both in the dark and during subsequent drifting grating stimulation. (E) Scatter plots of mean ∆F/F% for neurons in (D). (F) Histogram distributions of the ratios of mean ∆F/F% in the dark and under grating stimuli (Rdark/grating) for CP (red) and CT (blue) neurons in (D). (G,H) Raster plots of calcium transients (ΔF/F%) (G) and scatter plots of mean ∆F/F% for CP (red) and CT (blue) neurons with visually-evoked activity (H). Wilcoxon rank-sum test: *P < 0.05 and ***P < 0.001.
Figure 5
Figure 5
Activity of L6 CT and CP neurons shows distinct patterns of correlation with arousal level. (A,B) (Upper) Raster plots of calcium activity (ΔF/F%) of CT (A) or CP (B) neurons from two example FOVs recorded in the dark and during drifting grating visual stimulation. (Lower) Normalized pupil diameter (orange) recorded during the imaging sessions. (C) Histogram distributions of correlation coefficients between pupil diameter and drifting-grating-evoked activity for CT and CP neurons. (D) Histogram distributions of correlation coefficients between pupil diameter and spontaneous activity in the dark for CT and CP neurons. (E) Histogram distributions of correlation coefficients between pupil diameter and spontaneous activity during drifting grating stimulation. Dashed lines indicated medians for each population. (F,G) Scatter plots showing the absolute values of correlation coefficients measured in the dark against those measured during drifting grating stimulation for the same CP (F) and CT (G) neurons. Wilcoxon signed-rank test: ***P < 0.0001 for (F) and P = 0.082 for (G).
Figure 6
Figure 6
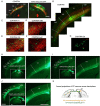
Extensive transcallosal projections to and from V1. (A) Unilateral injection of rAAV2-retro.CAG.GFP into right V1 of NTSR1-Cre × Ai14 mice, with CT neurons expressing tdTomato (red) and CP neurons in multiple cortical areas of the left hemisphere (contralateral side, CONTRA) labeled with GFP (green). (B) Contralateral (CONTRA) brain under high-zoom observation. (C-G) (left panels) Example coronal images of left V1 (C), V2M (D), V2L (E), AuC (F), and Ect (G). (H,I,J) Example coronal images (left panel) and zoomed-in views of V1 (right panel) of retrogradely labeled L6 CP neurons after injection of rAAV2-retro.CAG.GFP into V2M (H), V2L (I), or AuC (J). n = 2 mice for each group. (K) Schematic showing callosal projection patterns to and from V1. Scale bars: 1 mm in (A,H,I,J); 50 μm in (C–G).

Similar articles

Cited by

References

    1. Beloozerova IN, Sirota MG, Swadlow HA. 2003. Activity of different classes of neurons of the motor cortex during locomotion. J Neurosci. 23:1087–1097. - PMC - PubMed
    1. Bonin V, Histed MH, Yurgenson S, Reid RC. 2011. Local diversity and fine-scale organization of receptive fields in mouse visual cortex. J Neurosci. 31:18506–18521. - PMC - PubMed
    1. Bortone DS, Olsen SR, Scanziani M. 2014. Translaminar inhibitory cells recruited by layer 6 corticothalamic neurons suppress visual cortex. Neuron. 82:474–485. - PMC - PubMed
    1. Brown APY, Cossell L, Margrie TW. 2020. Excitatory and inhibitory L2/3 neurons in mouse primary visual cortex are balanced in their input connectivity. bioRxiv 2020.04.21.053504. doi: 10.1101/2020.04.21.053504. - DOI
    1. Chen T-W, Wardill TJ, Sun Y, Pulver SR, Renninger SL, Baohan A, Schreiter ER, Kerr RA, Orger MB, Jayaraman V et al.. 2013. Ultrasensitive fluorescent proteins for imaging neuronal activity. Nature. 499:295–300. - PMC - PubMed

Publication types