. 2021 Apr 6;24(5):102390.
doi: 10.1016/j.isci.2021.102390. eCollection 2021 May 21.

Endothelial SIRT3 regulates myofibroblast metabolic shifts in diabetic kidneys

Affiliations

Endothelial SIRT3 regulates myofibroblast metabolic shifts in diabetic kidneys

Swayam Prakash Srivastava et al. iScience. .

Abstract

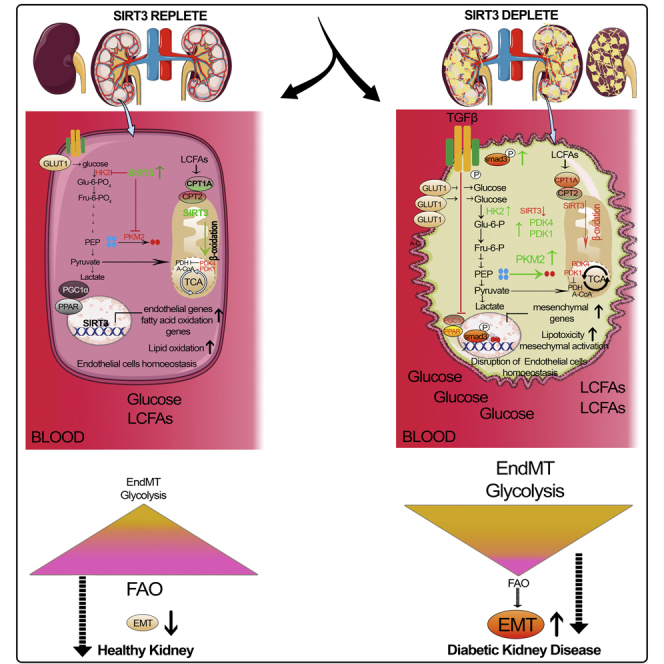
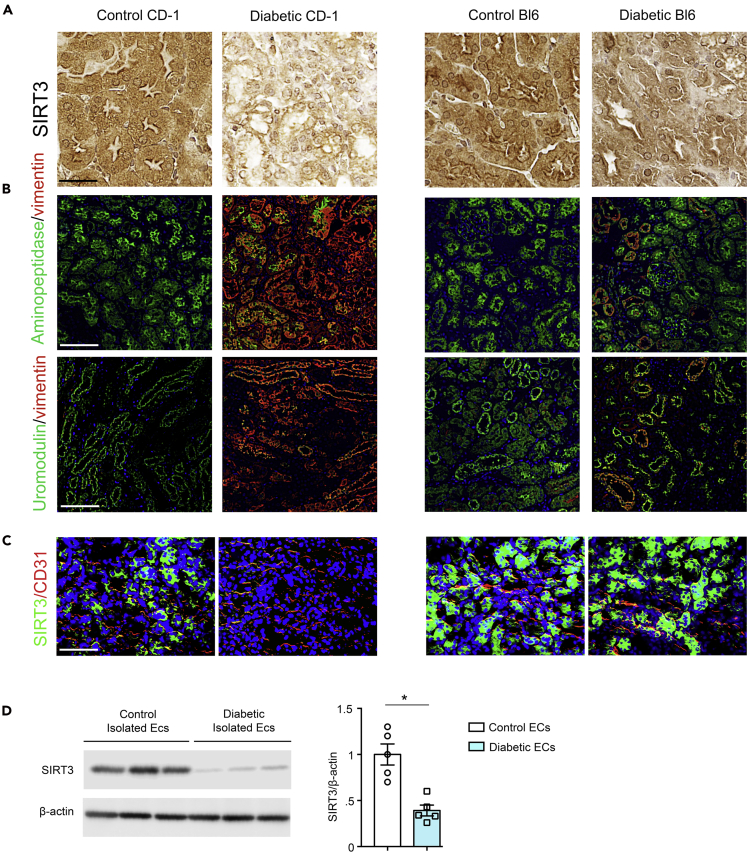
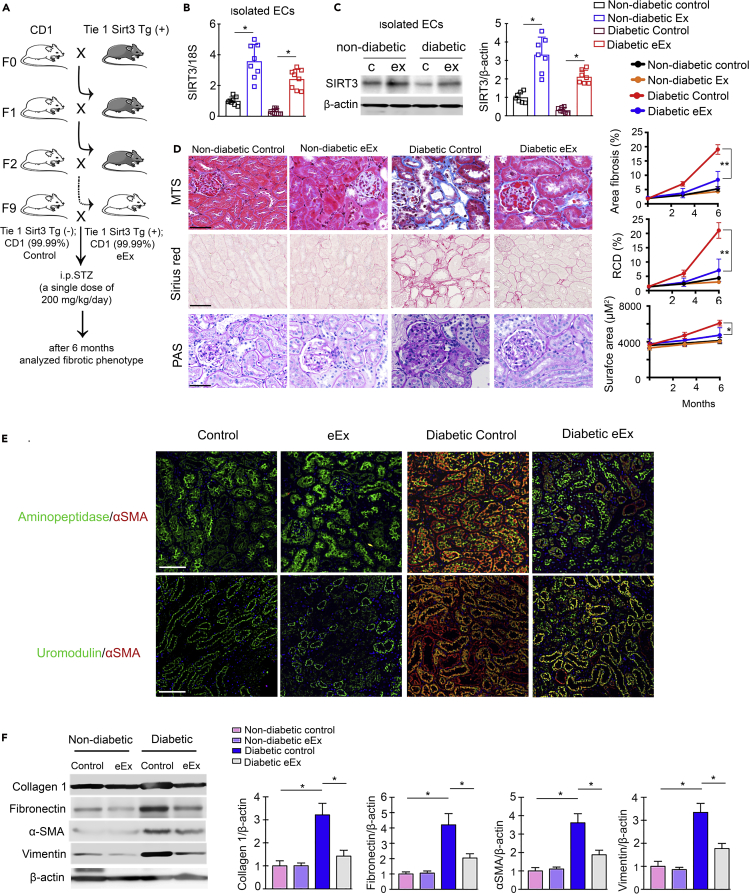
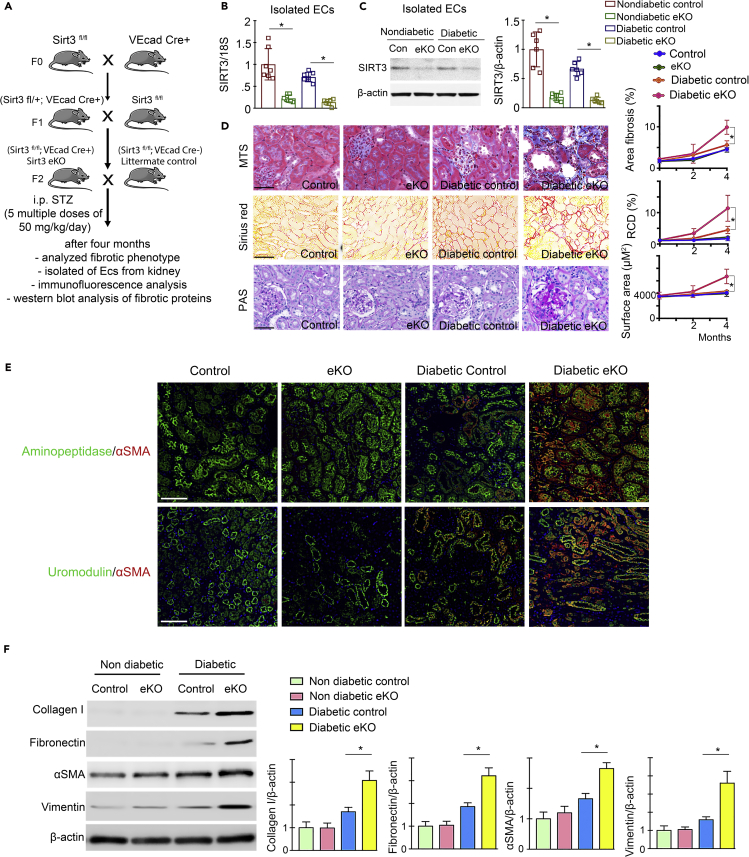
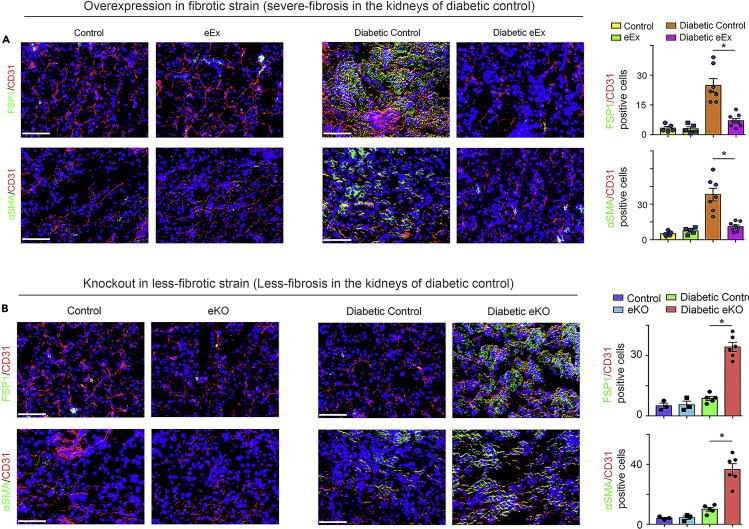
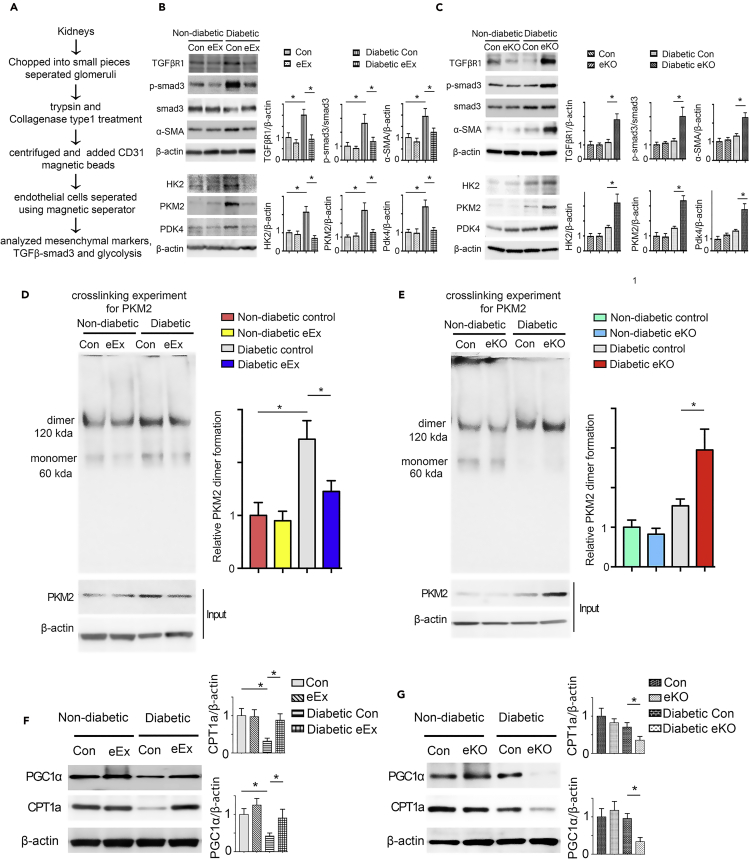
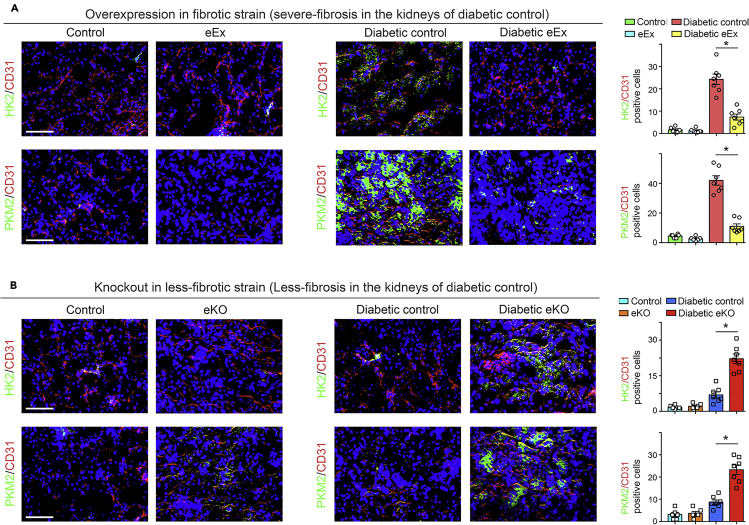
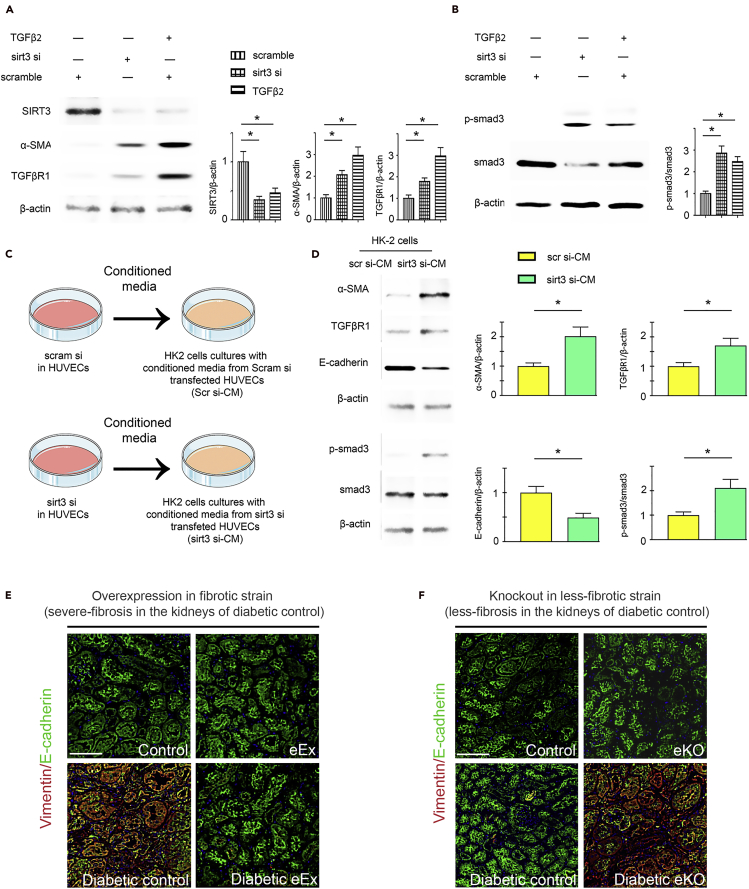
Defects in endothelial cells cause deterioration in kidney function and structure. Here, we found that endothelial SIRT3 regulates metabolic reprogramming and fibrogenesis in the kidneys of diabetic mice. By analyzing, gain of function of the SIRT3 gene by overexpression in a fibrotic mouse strain conferred disease resistance against diabetic kidney fibrosis, whereas its loss of function in endothelial cells exacerbated the levels of diabetic kidney fibrosis. Regulation of endothelial cell SIRT3 on fibrogenic processes was due to tight control over the defective central metabolism and linked activation of endothelial-to-mesenchymal transition (EndMT). SIRT3 deficiency in endothelial cells stimulated the TGFβ/Smad3-dependent mesenchymal transformations in renal tubular epithelial cells. These data demonstrate that SIRT3 regulates defective metabolism and EndMT-mediated activation of the fibrogenic pathways in the diabetic kidneys. Together, our findings show that endothelial SIRT3 is a fundamental regulator of defective metabolism regulating health and disease processes in the kidney.

Keywords: Biological Sciences; Cell Biology; Functional Aspects of Cell Biology.


Conflict of interest statement

The authors have declared that no conflict of interest exists.

Figures

None
Graphical abstract
Figure 1
Figure 1
Diabetic kidney disease is associated with suppression of endothelial SIRT3 protein (A) Immunohistochemical analysis of the kidneys of control and diabetic CD-1 and C57BL/6 mice. Representative pictures are shown. 40× images are shown. N = 7 per group. Scale bar, 50 μm. (B) Immunofluorescence analysis for aminopeptidase A/vimentin and uromodulin/vimentin in the kidneys of control and diabetic CD-1 and C57BL/6 mice. Representative pictures are shown. N = 7 per group. Scale bar, 50 μm. (C) Immunofluorescence analysis of the kidneys of control and diabetic CD-1 and C57BL/6 mice. FITC-labeled SIRT3, rhodamine-labeled CD31, and DAPI blue. Scale bar, 50 μm. Representative pictures are shown. 40× images are shown. N = 7 for CD1 mice, whereas N = 5 for C57BL/6 mice. Data in the graph are shown as mean ± SEM. (D) Western blot analysis of SIRT3 protein in isolated endothelial cells from the kidneys of control and diabetic CD-1 mice. Densitometry analysis was normalized by β-actin. N = 5 were analyzed in each group. Representative blots are shown. Data in the graph are shown as mean ± SEM. Student's t test was used for the analysis of statistical significance. ∗p < 0.05.
Figure 2
Figure 2
Overexpression of endothelial SIRT3 protects against fibrosis in the kidney of diabetic mice (A) Schematic chart of backcrossing of endothelial-specific Sirt3tg (Tie 1 Sirt3 tg+) with CD-1 mice. After the ninth generation, 99.99% of the genetic background of CD-1 mice was transferred. A single dose of STZ (200 mg/kg/day i.p.) was injected in the control (Tie 1 Sirt3 tg−; CD-1) and eEx (Tie 1 Sirt3 tg+; CD-1) mice to induce fibrosis. (B) SIRT3 mRNA expression was analyzed by qPCR in the isolated endothelial cells of eEX and control littermates. 18S was used as internal control. N = 8 per group. (C) Western blot analysis of SIRT3 protein in isolated endothelial cells from the kidney of control and eEx mice. N = 7 per group. Representative blots are shown. Densitometry calculation was normalized to β-actin. (D) Masson trichrome, Sirius red, and PAS staining in the kidney of non-diabetic and diabetic eEx and control littermates. Representative images are shown. Area of fibrosis (%), relative collagen deposition (RCD %), and surface area (μm2) were measured using the ImageJ program. N = 7 per group. Scale bar, 50 μm. 40× images in the MTS and PAS, whereas 30× images in Sirius red. Data in the graph are shown as mean ± SEM. (E) Immunofluorescence analysis for aminopeptidase A/αSMA and uromodulin/αSMA in the kidneys of non-diabetic and diabetic control and eEx mice. Representative images are shown. Scale bar, 50 mm in each panel. N = 7 per group. (F) Western blot analysis of collagen I, fibronectin, α-SMA, and vimentin in the kidney of non-diabetic and diabetic control and eEx mice. N = 5 per group. Representative blots are shown. Densitometry calculation was normalized to β-actin. Data in the graph are shown as mean ± SEM. One-way ANOVA Tukey post hoc test was used for the analysis of statistical significance. ∗p < 0.05.
Figure 3
Figure 3
Loss of endothelial SIRT3 worsens renal fibrosis in the mouse model of diabetic kidney disease (A) Schematic chart showing the generation of endothelial-specific Sirt3 knockout mice. Five multiple low doses of STZ (50 mg/kg/day i.p.) were injected in the control (Sirt3 fl/fl; VeCad Cre−) and eKO (Sirt3 fl/fl; VeCad Cre+) mice to induce fibrosis. (B) SIRT3 mRNA expression level was analyzed by qPCR in the isolated endothelial cells of eKO and control littermates. 18S was used as internal control. N = 7 per group. (C) Western blot analysis of SIRT3 protein in isolated endothelial cells from the kidneys of control and eKO mice. N = 6 per group. Representative blots are shown. (D) Masson trichrome, Sirius red, and PAS staining in the kidneys of non-diabetic and diabetic control littermates and eKO mice. Representative images are shown. Area of fibrosis (%), relative collagen deposition (RCD %), and surface area were measured using the ImageJ program. N = 7 per group. Data in the graph are shown as mean ± SEM. Scale bar: 50 μm in MTS and PAS panel and 70 μm in Sirius red. 40× images in the MTS and PAS and 30× images in the Sirius red panel. (E) Immunofluorescence analysis for aminopeptidase A/αSMA and uromodulin/αSMA in the kidneys of non-diabetic and diabetic control littermates and eKO mice. Representative images are shown. Scale bar, 50 mm in each panel. N = 7 per group. (F) Western blot analysis of collagen I, fibronectin, α-SMA, and vimentin in the kidney of non-diabetic and diabetic control littermates and eKO mice. N = 6 per group. Representative blots are shown. Densitometry calculation was normalized to β-actin. Data in the graph are shown as mean ± SEM. One-way ANOVA Tukey post hoc test was used for the analysis of statistical significance. ∗p < 0.05.
Figure 4
Figure 4
SIRT3 regulates the endothelial-to-mesenchymal transition in the kidney (A) Immunofluorescence analysis was performed in the kidneys of non-diabetic and diabetic control littermates and eEx mice by fluorescence microscopy. FSP-1 and α-SMA protein levels were analyzed in CD31-positive cells. Merged and representative pictures are shown. N = 5 non-diabetic group, N = 7 diabetic control group, N = 8 diabetic eEx group. (B) Immunofluorescence analysis was performed in the kidneys of non-diabetic and diabetic control and eKO mice by fluorescence microscopy. FSP-1 and α-SMA protein levels were analyzed in CD31-positive cells. Merged and representative pictures are shown. N = 3 non-diabetic group, N = 5 diabetic control group, N = 6 diabetic eKO group. Scale bar, 50 mm in each panel. 40× images are shown. Data in the graph are shown as mean ± SEM. One-way ANOVA Tukey post hoc test was used for the analysis of statistical significance. ∗p < 0.05.
Figure 5
Figure 5
SIRT3 regulates metabolic reprogramming in the endothelial cells-derived fibroblasts in kidney (A) Schematic diagram showing the isolation of endothelial cells from the non-diabetic and diabetic mice. (B) Western blot analysis of TGFβR1, smad3 phosphorylation, total smad3, α-SMA, HK2, PKM2, and PDK4 in the lysates of isolated endothelial cells from non-diabetic and diabetic kidneys of control littermates and eEx mice. Representative blots are shown. Densitometry calculations were normalized to β-actin. N = 6 were analyzed in each group. (C) Western blot analysis of TGFβR1, smad3 phosphorylation, total smad3, α-SMA, HK2, PKM2, and PDK4 in the lysates of isolated endothelial cells from non-diabetic and diabetic kidneys of control and eKO mice. Representative blots are shown. Densitometry calculations were normalized to β-actin. N = 5 for non-diabetic group, N = 6 for diabetic group. (D) Glutaraldehyde chemical cross-linking experiment for PKM2 was performed in the isolated endothelial cells from the non-diabetic and diabetic kidneys of control and eEx mice. The representative blot from five blots is shown. N = 5 per group. (E) Glutaraldehyde chemical cross-linking experiment for PKM2 was performed in the isolated endothelial cells from the non-diabetic and diabetic kidneys of control and eKO mice. The representative blot from five blots is shown. N = 5 per group. (F) Western blot analysis of CPT1a and PGC1α in the lysates of isolated endothelial cells from the non-diabetic and diabetic kidneys of control and eEx mice. Representative blots are shown. Densitometry calculations were normalized to β-actin. N = 5/group. Data in the graph are shown as mean ± SEM. (G) Western blot analysis of CPT1a and PGC1α in the lysates of isolated endothelial cells from the non-diabetic and diabetic kidneys of control and eKO mice. Representative blots are shown here. Densitometry calculations were normalized to β-actin. N = 5 non-diabetic group, N = 6 diabetic group. Data in the graph are shown as mean ± SEM. One-way ANOVA Tukey post hoc test was used for the analysis of statistical significance. ∗p < 0.05.
Figure 6
Figure 6
SIRT3 regulates defective glucose metabolism in the kidney endothelial cells (A) Immunofluorescence analysis was performed in the kidneys of non-diabetic and diabetic control and eEx mice by fluorescence microscopy. HK2 and PKM2 protein expression was analyzed in the CD31-positive cells. Merged and representative pictures are shown. N = 5 non-diabetic group, N = 7 diabetic control and diabetic eEx group. (B) Immunofluorescence analysis was performed in the kidneys of non-diabetic and diabetic control and eKO mice by fluorescence microscopy. HK2 and PKM2 protein expression was analyzed in the CD31-positive cells. Merged and representative pictures are shown. N = 5 non-diabetic group, N = 7 for diabetic control and diabetic eKO group. Scale bar, 50 mm in each panel. 40× images are shown. Data in the graph are shown as mean ± SEM. One-way ANOVA Tukey post hoc test was used for the analysis of statistical significance. ∗p < 0.05.
Figure 7
Figure 7
SIRT3 deficiency disrupts metabolic homeostasis in endothelial cells Brdu cell proliferation assay in control siRNA- and Sirt3 siRNA-transfected HUVECs. Treatment with DCA (glycolysis inhibitor), etomoxir (CPT1a inhibitor), and fenofibrate (PPARα agonist) in control siRNA- and Sirt3 siRNA-transfected HUVECs. Three independent sets of experiments were performed. (B) Glucose uptake assay in the experimental groups was analyzed by fluorimetric method. Three independent sets of experiments were performed. (C) GLUT1 translocation from cytoplasm to cell membrane (using CD31 as an endothelial cell marker) in the experimental groups was analyzed using immunofluorescence. GLUT1, green: FITC; CD31, red: rhodamine, and DAPI: blue. Scale bar, 50 μm. (D) Western blot analysis of SIRT3, PKM2, and PPARα in SIRT3 siRNA knockdown cells treated with glycolysis inhibitors (DCA and 2-DG); fatty acid modulators, i.e., etomoxir (CPT1a inhibitor); C75 (fatty acid synthase inhibitor); and fenofibrate (PPARα agonist). Representative blots from four blots are shown. Densitometry analysis by ImageJ. The data in the each graph are normalized by β-actin. (E) Measurement of fatty acid uptake by radioactivity incorporation using 14C palmitate in 4 h serum-starved HUVECs. Samples in tetraplicate were analyzed. CPM were counted and normalized to protein. (F) 14C palmitate oxidation measured by 14CO2 release. CPM were counted and normalized to the protein in the well. Samples in tetraplicate were analyzed. Data in the graph are shown as mean ± SEM. One-way ANOVA Tukey post hoc test was used for the analysis of statistical significance. ∗p < 0.05.
Figure 8
Figure 8
SIRT3 deficiency in endothelial cells causes mesenchymal activation in renal tubular epithelial cells (A) Western blot analysis of SIRT3, α-SMA, and TGFβR1 in the scramble siRNA, sirt3 siRNA-transfected, and TGFβ2-stimulated HUVECs. (B) Smad3 phosphorylation and total smad3 in the scramble siRNA, sirt3 siRNA-transfected, and TGFβ2-stimulated HUVECs. Representative blots are shown. Densitometry calculations are normalized by β-actin. Three independent experiments were performed. (C) Design of conditioned media experiment. Renal tubular epithelial cells (HK2 cells) were cultured in the conditioned media either from scramble siRNA- or sirt3 siRNA-transfected endothelial cells (HUVECs). (D) Representative western blot images of the indicated molecules from three independent experiments are shown. Densitometric analysis of the levels relative to β-actin is shown. Data in the graph are shown as mean ± SEM. (E) Immunofluorescence analysis for vimentin/E-cadherin in the kidneys of non-diabetic and diabetic control littermates and eEx mice. Representative pictures are shown. N = 7 per group. Scale bar, 50 μm. (F) Immunofluorescence analysis for vimentin/E-cadherin in the kidneys of non-diabetic and diabetic control littermates and eKO mice. Representative pictures are shown. N = 7 per group. Scale bar, 50 μm. Data in the graph are shown as mean ± SEM. One-way ANOVA Tukey post hoc test was used for the analysis of statistical significance. ∗p < 0.05.

Similar articles

Cited by

References

    1. Badal S.S., Danesh F.R. New insights into molecular mechanisms of diabetic kidney disease. Am. J. Kidney Dis. 2014;63:S63–S83. - PMC - PubMed
    1. Breyer M.D., Susztak K. The next generation of therapeutics for chronic kidney disease. Nat. Rev. Drug Discov. 2016;15:568–588. - PMC - PubMed
    1. Cantelmo A.R., Conradi L.C., Brajic A., Goveia J., Kalucka J., Pircher A., Chaturvedi P., Hol J., Thienpont B., Teuwen L.A. Inhibition of the glycolytic activator PFKFB3 in endothelium induces tumor vessel normalization, impairs metastasis, and improves chemotherapy. Cancer Cell. 2016;30:968–985. - PMC - PubMed
    1. Chen P.Y., Qin L., Barnes C., Charisse K., Yi T., Zhang X., Ali R., Medina P.P., Yu J., Slack F.J. FGF regulates TGF-beta signaling and endothelial-to-mesenchymal transition via control of let-7 miRNA expression. Cell Rep. 2012;2:1684–1696. - PMC - PubMed
    1. Chen T., Li J., Liu J., Li N., Wang S., Liu H., Zeng M., Zhang Y., Bu P. Activation of SIRT3 by resveratrol ameliorates cardiac fibrosis and improves cardiac function via the TGF-beta/Smad3 pathway. Am. J. Physiol. Heart Circ. Physiol. 2015;308:H424–H434. - PubMed

LinkOut - more resources