. 2021 Jun;20(6):e13373.
doi: 10.1111/acel.13373. Epub 2021 May 12.

Smc5/6 in the rDNA modulates lifespan independently of Fob1​

Affiliations

Smc5/6 in the rDNA modulates lifespan independently of Fob1​

Sarah Moradi-Fard et al. Aging Cell. 2021 Jun.

Abstract

The ribosomal DNA (rDNA) in Saccharomyces cerevisiae is in one tandem repeat array on Chromosome XII. Two regions within each repetitive element, called intergenic spacer 1 (IGS1) and IGS2, are important for organizing the rDNA within the nucleolus. The Smc5/6 complex localizes to IGS1 and IGS2. We show that Smc5/6 has a function in the rDNA beyond its role in homologous recombination (HR) at the replication fork barrier (RFB) located in IGS1. Fob1 is required for optimal binding of Smc5/6 at IGS1 whereas the canonical silencing factor Sir2 is required for its optimal binding at IGS2, independently of Fob1. Through interdependent interactions, Smc5/6 stabilizes Sir2 and Cohibin at both IGS and its recovery at IGS2 is important for nucleolar compaction and transcriptional silencing, which in turn supports rDNA stability and lifespan.

Keywords: Fob1; Smc5/6; nucleolar morphology; nucleolus; rDNA; replicative lifespan; silencing.


Conflict of interest statement

The authors declare that they have no conflicts of interest with the contents of this article.

Figures

FIGURE 1
FIGURE 1
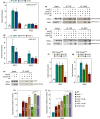
Smc5/6 localization to IGS1 and IGS2 is important for lifespan. (a) Schematic of rDNA repeats in Saccharomyces cerevisiae showing non‐transcribed spacers (IGS1 and IGS2) flanking the transcribed 5S and 35S sequences in one repeat. The location of primer sites used in ChIP experiments are illustrated. (b) Enrichment of Smc5FLAG at IGS1 and IGS2 by ChIP with α ‐FLAG antibody in non‐tagged control (JC 470), WT (JC 3728), smc6‐9 (JC 5894) and nse3‐1 (JC 5879) at IGS1 and IGS2. Fold enrichment is based on normalization to negative control region as described in the experimental procedures. (c) Replicative lifespan measured and represented as percentage of survival of mother cells with each division for WT (JC 471), smc6‐9 (JC 1358) and nse31 (JC 3032) strains. (d and e) Transcription at (d) IGS1 and (e) IGS2 relative to WT cells after normalization to ACT1 transcription for WT (JC 471), smc6‐9 (JC 1358) and nse3‐1 (JC 3032). Analysis was performed using at least three biological replicates. Asterisks indicate statistical significance versus WT unless otherwise noted. Statistical analysis is described in Section 4
FIGURE 2
FIGURE 2
Smc5/6 tethers rDNA repeats at the periphery and interacts with Heh1. (a) Nucleolus morphology is illustrated by imaging CFP‐tagged NOP1 in WT (JC 4676), smc6‐9 (JC 4932), nse3‐1 (JC 4729), heh1Δ (JC 4735), lrs4Δ (JC 4731) and sir2Δ (JC 4633); GFP‐tagged NUP49 indicates nuclear periphery boundaries. (b) Scatter plot data of nucleolar volume for WT (JC 5016), smc6‐9 (JC 5014), nse3‐1 (JC 5015), heh1Δ (JC 4735), lrs4Δ (JC 4731) and sir2Δ (JC 4633) were measured in pixel and represented relative to mean of WT as described in Section 4. (c) Enrichment of Heh1MYC at IGS1 and IGS2 by ChIP with α‐MYC in non‐tagged control (JC 470), WT (JC 4022), nse3‐1 (JC 4228) and smc6‐9 (JC 4942) at IGS1 and IGS2. Fold enrichment is represented as relative to no tag control after normalization to the negative control region described in Figure1. (d) Co‐IP between Smc6FLAG and Heh1TAP followed by western blotting with antibodies to epitope tags on each protein in the in negative controls (JC 1594; for α‐TAP IP) or (JC 4107, for α‐FLAG IP), WT (JC 4811) and nse3‐1 (JC 4813) cells. (e) Schematic representation of Smc5/6 in rDNA tethering at the periphery in wild type and nse3‐1 cells. Asterisks indicate statistical significance versus WT unless otherwise noted. Analysis was performed using at least three biological replicates. Statistical analysis is described in Section 4
FIGURE 3
FIGURE 3
Interplay between Smc5/6, Cohibin and RENT maintain Transcriptional silencing at IGS1 and IGS2. (a) Enrichment of Csm1TAP at IGS1 and IGS2 by ChIP with α‐TAP in WT (JC 4233), smc6‐9 (JC 4938) and nse3‐1 (JC 4251) at IGS1 and IGS2. Fold enrichment is based on normalization to negative control described in Figure 1. (b) Co‐IP between Smc6FLAG and Csm1TAP followed with western blotting using corresponding antibodies to epitope tags on each protein. IPs were performed in negative control (JC 1594; for α‐TAP IP) or (JC 4233; for α‐FLAG IP), WT (JC 4598) and nse3‐1 (JC 4712). (c) Co‐IP between Csm1TAP and Heh1MYC followed with western blotting using corresponding antibodies to epitope tags on each protein. IPs were performed in negative control (JC 4224; for α‐TAP IP) or (JC 4233; for α‐MYC IP), WT (JC 4774) and nse3‐1 (JC 4773). (d) Enrichment of Sir2 at IGS1 and IGS2 by ChIP with α‐Sir2 in WT (JC 471), smc6‐9 (JC 1358) and nse3‐1(JC 3032) strains at IGS1 and IGS2. Fold enrichment is based on normalization to negative control region described in Figure 1 relative to no antibody control (beads only). (e) Co‐IP between Sir2 and Smc6FLAG followed with western blotting using antibodies against Sir2 or FLAG. IP was performed in negative control (JC 471), WT (JC 1595) and nse3‐1 (JC 3078). (f and g) Enrichment of Smc6FLAG at IGS1 (f) and IGS2 (g) by ChIP with α‐FLAG in no‐tag control (NT; JC 471) WT (JC 1595), sir2Δ (JC 4699), csm1Δ (JC 4243) and nse3‐1 (JC 3078). Fold enrichment is based on normalization to negative control region. (h and i)Transcription at IGS1 (h) and IGS2 (i) relative to WT cells after normalization to ACT1 expression for WT (JC 471), nse3‐1 (JC 3032), lrs4Δ (JC 3791), nse3‐1 lrs4Δ (JC 3796), sir2Δ (JC 4648), nse3‐1 sir2Δ (JC 3787) and sir2Δ lrs4Δ (JC 4979). Asterisks indicate statistical significance versus WT unless otherwise noted. Analysis was performed using at least three biological replicates. Statistical analysis is described in Section 4
FIGURE 4
FIGURE 4
Smc5/6 function at IGS2 is important for nucleolar homeostasis independent of HR processing at the RFB. (a and b) Transcription of IGS1 (a) and IGS2 (b) measured and represented as relative to WT cells after normalization to ACT1 expression for WT (JC 471), fob1Δ (JC 4825), nse3‐1 (JC 3032), nse3‐1 fob1Δ (JC 4595), smc6‐9 (JC 1358) and smc6‐9 fob1Δ (JC 4824) strains. (c) Replicative lifespan measured and represented as percentage of survival of mother cells with each division for WT (JC 471), fob1Δ (JC 4825), nse3‐1 (JC 3032), nse3‐1 fob1Δ (JC 4595), smc6‐9 (JC 1358) and smc6‐9 fob1Δ (JC 4824) strains. (d) Scatter plot data of nucleolar volume for WT (JC 5016), fob1Δ (JC 4985), nse3‐1 (JC 5015), nse3‐1 fob1Δ (JC 5110), smc6‐9 (JC 5014) and smc6‐9 fob1Δ (JC 5113) strains were measured in pixel and represented relative to mean of WT. (e) ERC molecules abundance in WT (JC 471), fob1Δ (JC 4825), nse3‐1 (JC 3032), nse3‐1 fob1Δ (JC 4595), smc6‐9 (JC 1358) and smc6‐9 fob1Δ (JC 4824) strains. (f and g) Enrichment of Smc5MYC at IGS1 (f) and IGS2 (g) by ChIP with α‐MYC in WT (JC 3467), fob1Δ (JC 5041); nse3‐1 (JC 3483), nse3‐1 fob1Δ (JC 5044), smc6‐9 (JC 5039) and smc6‐9 fob1Δ (JC 5040). Fold enrichment is based on normalization to negative control region as described in Figure1. Asterisks indicate statistical significance versus WT unless otherwise noted. Analysis was performed using at least three biological replicates. Statistical analysis is described in Section 4
FIGURE 5
FIGURE 5
Schematic model for Smc5/6 functionality at the rDNA in the nucleolus. (a) In WT cells, nucleolar morphology is compact. Smc5/6 binds to the rDNA array at IGS1 and IGS2 and physically interacts with chromatin and canonical rDNA factors, Sir2, Cohibin. IGS regions are silenced and the repeats are tethered to the periphery through interaction with the CLIP complex. (b) In nse3‐1 mutant cells, Smc5/6 fails to bind rDNA repeats, yet it still physically interacts with Sir2, Cohibin and Heh1. Loss of the Smc5/6 complex results in defective silencing at both IGS1 and IGS2, accumulation of ERC molecules and increased nucleolar volume. (c) In fob1Δ mutants, the binding of Sir2, Cohibin and Smc5/6 with IGS1 is reduced and transcription from IGS1 increases. Tethering through CLIP is lost, however, all factors bind and silence at IGS2 and the nucleolar morphology is compact

Similar articles

Cited by

References

    1. Austriaco, N. R. Jr , & Guarente, L. P. (1997). Changes of telomere length cause reciprocal changes in the lifespan of mother cells in Saccharomyces cerevisiae . Proceedings of the National Academy of Sciences of the United States of America, 94, 9768–9772. - PMC - PubMed
    1. Bairwa, N. K. , Zzaman, S. , Mohanty, B. K. , & Bastia, D. (2010). Replication fork arrest and rDNA silencing are two independent and separable functions of the replication terminator protein Fob1 of Saccharomyces cerevisiae . Journal of Biological Chemistry, 285, 12612–12619. - PMC - PubMed
    1. Brewer, B. J. , & Fangman, W. L. (1988). A replication fork barrier at the 3’ end of yeast ribosomal RNA genes. Cell, 55, 637–643. - PubMed
    1. Bryk, M. , Banerjee, M. , Murphy, M. , Knudsen, K. E. , Garfinkel, D. J. , & Curcio, M. J. (1997). Transcriptional silencing of Ty1 elements in the RDN1 locus of yeast. Genes & Development, 11, 255–269. - PubMed
    1. Buck, S. W. , Maqani, N. , Matecic, M. , Hontz, R. D. , Fine, R. D. , Li, M. , & Smith, J. S. (2016). RNA polymerase I and Fob1 contributions to transcriptional silencing at the yeast rDNA locus. Nucleic Acids Research, 44, 6173–6184. - PMC - PubMed

Publication types

MeSH terms

LinkOut - more resources