

Neutralizing antibody responses to SARS-CoV-2 in symptomatic COVID-19 is persistent and critical for survival
- PMID: 33976165
- PMCID: PMC8113594
- DOI: 10.1038/s41467-021-22958-8
Neutralizing antibody responses to SARS-CoV-2 in symptomatic COVID-19 is persistent and critical for survival
Abstract
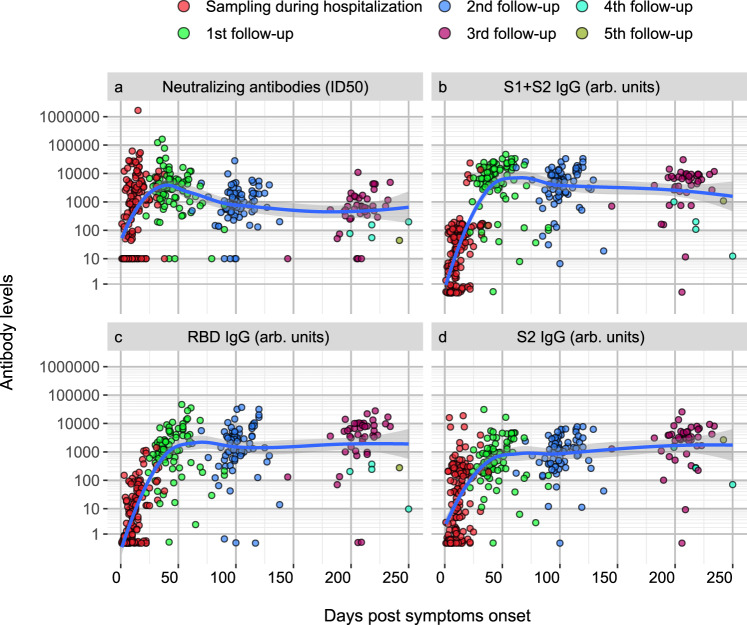
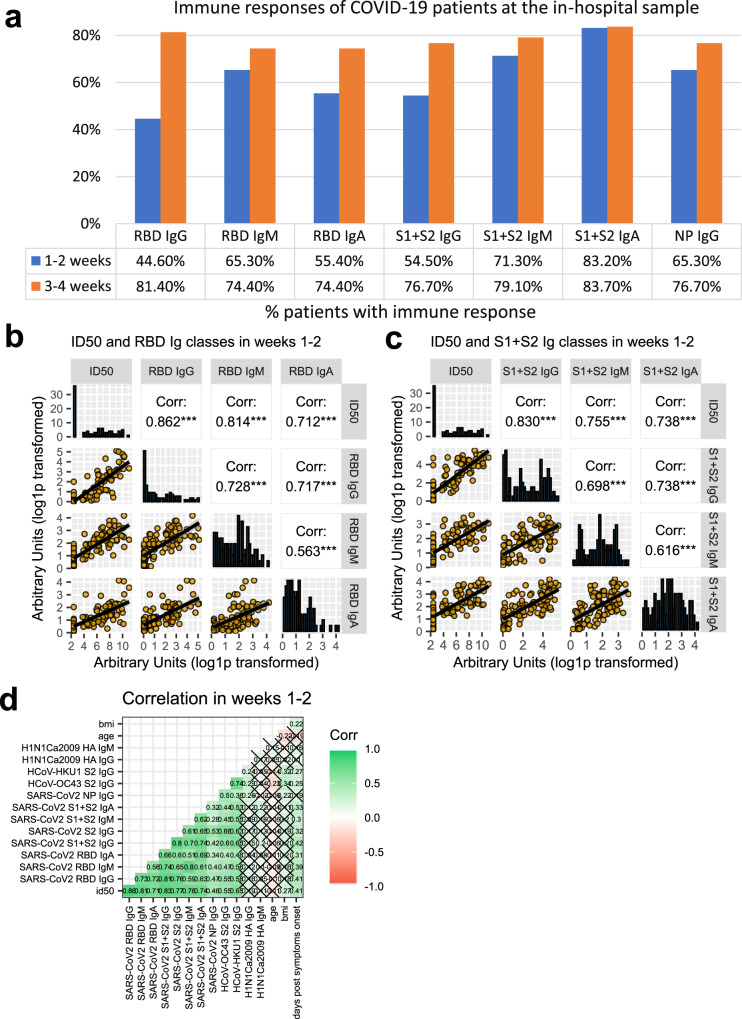
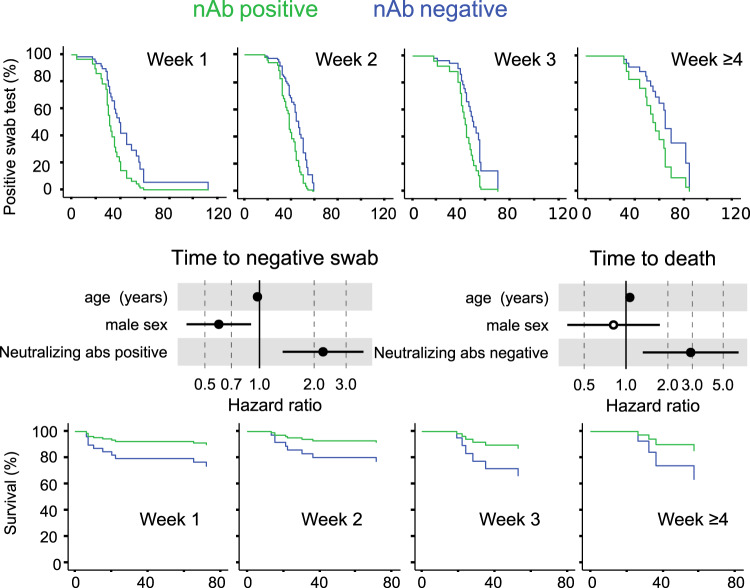
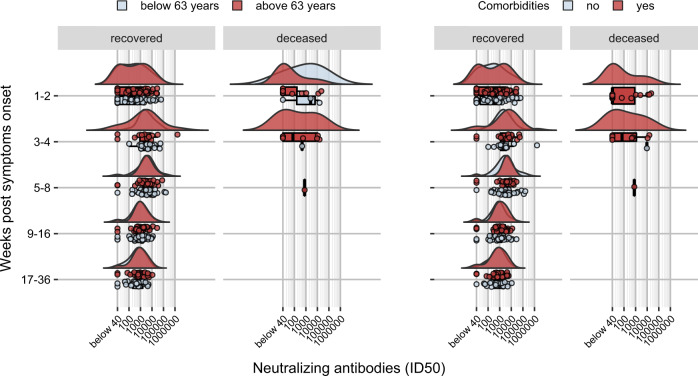
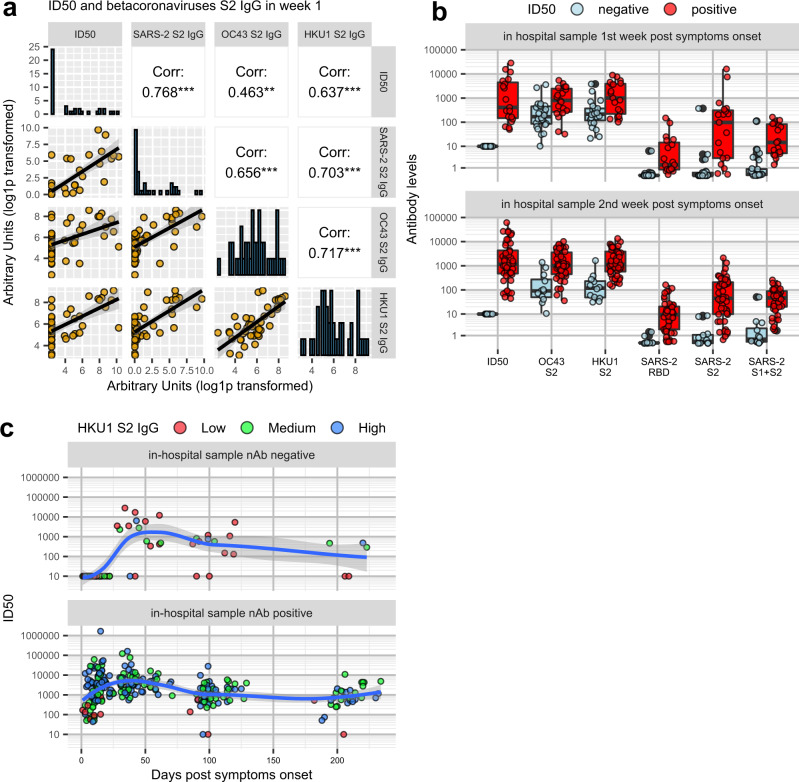
Understanding how antibody responses to SARS-CoV-2 evolve during infection may provide important insight into therapeutic approaches and vaccination for COVID-19. Here we profile the antibody responses of 162 COVID-19 symptomatic patients in the COVID-BioB cohort followed longitudinally for up to eight months from symptom onset to find SARS-CoV-2 neutralization, as well as antibodies either recognizing SARS-CoV-2 spike antigens and nucleoprotein, or specific for S2 antigen of seasonal beta-coronaviruses and hemagglutinin of the H1N1 flu virus. The presence of neutralizing antibodies within the first weeks from symptoms onset correlates with time to a negative swab result (p = 0.002), while the lack of neutralizing capacity correlates with an increased risk of a fatal outcome (p = 0.008). Neutralizing antibody titers progressively drop after 5-8 weeks but are still detectable up to 8 months in the majority of recovered patients regardless of age or co-morbidities, with IgG to spike antigens providing the best correlate of neutralization. Antibody responses to seasonal coronaviruses are temporarily boosted, and parallel those to SARS-CoV-2 without dampening the specific response or worsening disease progression. Our results thus suggest compromised immune responses to the SARS-CoV-2 spike to be a major trait of COVID-19 patients with critical conditions, and thereby inform on the planning of COVID-19 patient care and therapy prioritization.
Conflict of interest statement
V.L., M.S., and L.P. have a patent pending that refers to polypeptides, nucleic acids, vectors, and host cells and their use to detect SARS-CoV-2 antibodies with LIPS. All other authors have no competing interests.
Figures
Similar articles
-
Antibody Response against SARS-CoV-2 and Seasonal Coronaviruses in Nonhospitalized COVID-19 Patients.mSphere. 2021 Feb 24;6(1):e01145-20. doi: 10.1128/mSphere.01145-20. mSphere. 2021. PMID: 33627511 Free PMC article.
-
Sequential Analysis of Binding and Neutralizing Antibody in COVID-19 Convalescent Patients at 14 Months After SARS-CoV-2 Infection.Front Immunol. 2021 Nov 26;12:793953. doi: 10.3389/fimmu.2021.793953. eCollection 2021. Front Immunol. 2021. PMID: 34899762 Free PMC article.
-
Original antigenic sin responses to Betacoronavirus spike proteins are observed in a mouse model, but are not apparent in children following SARS-CoV-2 infection.PLoS One. 2021 Aug 27;16(8):e0256482. doi: 10.1371/journal.pone.0256482. eCollection 2021. PLoS One. 2021. PMID: 34449792 Free PMC article.
-
Correlates of protection against SARS-CoV-2 infection and COVID-19 disease.Immunol Rev. 2022 Sep;310(1):6-26. doi: 10.1111/imr.13091. Epub 2022 Jun 5. Immunol Rev. 2022. PMID: 35661178 Free PMC article. Review.
-
Immune response following infection with SARS-CoV-2 and other coronaviruses: A rapid review.Rev Med Virol. 2021 Mar;31(2):e2162. doi: 10.1002/rmv.2162. Epub 2020 Sep 23. Rev Med Virol. 2021. PMID: 32964627 Free PMC article. Review.
Cited by
-
Heterologous immunity induced by 1st generation COVID-19 vaccines and its role in developing a pan-coronavirus vaccine.Front Immunol. 2022 Aug 15;13:952229. doi: 10.3389/fimmu.2022.952229. eCollection 2022. Front Immunol. 2022. PMID: 36045689 Free PMC article. Review.
-
Defining the determinants of protection against SARS-CoV-2 infection and viral control in a dose-down Ad26.CoV2.S vaccine study in nonhuman primates.PLoS Biol. 2022 May 5;20(5):e3001609. doi: 10.1371/journal.pbio.3001609. eCollection 2022 May. PLoS Biol. 2022. PMID: 35512013 Free PMC article.
-
Isolation and Characterization of Mouse Monoclonal Antibodies That Neutralize SARS-CoV-2 and Its Variants of Concern Alpha, Beta, Gamma and Delta by Binding Conformational Epitopes of Glycosylated RBD With High Potency.Front Immunol. 2021 Oct 26;12:750386. doi: 10.3389/fimmu.2021.750386. eCollection 2021. Front Immunol. 2021. PMID: 34764961 Free PMC article.
-
A Case Study to Dissect Immunity to SARS-CoV-2 in a Neonate Nonhuman Primate Model.Front Immunol. 2022 May 4;13:855230. doi: 10.3389/fimmu.2022.855230. eCollection 2022. Front Immunol. 2022. PMID: 35603150 Free PMC article.
-
The glycosylation in SARS-CoV-2 and its receptor ACE2.Signal Transduct Target Ther. 2021 Nov 15;6(1):396. doi: 10.1038/s41392-021-00809-8. Signal Transduct Target Ther. 2021. PMID: 34782609 Free PMC article. Review.
References
Publication types
MeSH terms
Substances
Grants and funding
LinkOut - more resources
Full Text Sources
Other Literature Sources
Medical
Miscellaneous
