. 2021 Jun 23;41(25):5353-5371.
doi: 10.1523/JNEUROSCI.2562-20.2021. Epub 2021 May 11.

Glutamate Signaling via the AMPAR Subunit GluR4 Regulates Oligodendrocyte Progenitor Cell Migration in the Developing Spinal Cord

Affiliations

Glutamate Signaling via the AMPAR Subunit GluR4 Regulates Oligodendrocyte Progenitor Cell Migration in the Developing Spinal Cord

Melanie Piller et al. J Neurosci. .

Abstract

Oligodendrocyte progenitor cells (OPCs) are specified from discrete precursor populations during gliogenesis and migrate extensively from their origins, ultimately distributing throughout the brain and spinal cord during early development. Subsequently, a subset of OPCs differentiates into mature oligodendrocytes, which myelinate axons. This process is necessary for efficient neuronal signaling and organism survival. Previous studies have identified several factors that influence OPC development, including excitatory glutamatergic synapses that form between neurons and OPCs during myelination. However, little is known about how glutamate signaling affects OPC migration before myelination. In this study, we use in vivo, time-lapse imaging in zebrafish in conjunction with genetic and pharmacological perturbation to investigate OPC migration and myelination when the GluR4A ionotropic glutamate receptor subunit is disrupted. In our studies, we observed that gria4a mutant embryos and larvae displayed abnormal OPC migration and altered dorsoventral distribution in the spinal cord. Genetic mosaic analysis confirmed that these effects were cell-autonomous, and we identified that voltage-gated calcium channels were downstream of glutamate receptor signaling in OPCs and could rescue the migration and myelination defects we observed when glutamate signaling was perturbed. These results offer new insights into the complex system of neuron-OPC interactions and reveal a cell-autonomous role for glutamatergic signaling in OPCs during neural development.SIGNIFICANCE STATEMENT The migration of oligodendrocyte progenitor cells (OPCs) is an essential process during development that leads to uniform oligodendrocyte distribution and sufficient myelination for central nervous system function. Here, we demonstrate that the AMPA receptor (AMPAR) subunit GluR4A is an important driver of OPC migration and myelination in vivo and that activated voltage-gated calcium channels are downstream of glutamate receptor signaling in mediating this migration.

Keywords: glutamate signaling; myelin; oligodendrocyte; oligodendrocyte progenitor cell; zebrafish.


Figures

Figure 1.
Figure 1.
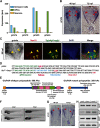
The AMPAR subunit gene gria4a is expressed in spinal cord OPCs. A, Expression of AMPAR subunits by cell type, in transcripts per million (tpm). B, In situ hybridization shows gria4a expression (red arrows) in wild-type spinal cord cross-sections at 48 and 72 hpf (scale bar: 20 µm). C, In situ hybridization for gria4a mRNA, immunohistochemistry for Sox10, and transgenic fluorescent labeling of olig2 expression show gria4a+/olig2+/Sox10+ OPCs at 80 hpf (yellow arrows; scale bar: 20 µm). gria4a-/olig2+/Sox10+ ventral spinal cord OPCs are also observed (yellow arrowheads). D, Nucleotide sequence of relevant portion of exon 6 in the wild-type gria4a gene compared with the gria4auva43/uva43 Glu286 > Stop mutation sequence. E, Schematic of wild-type GluR4A polypeptide compared with the gria4auva43/uva43 polypeptide. F, Representative images of gria4a+/+ and gria4auva43/uva43 larvae at 2 and 5 dpf (scale bar: 1 mm). G, In situ hybridization for gria4a mRNA in gria4auva43/uva43 larvae (scale bar: 20 µm). Red arrowheads denote expression in white matter-associated cells. H, Representative images of RT-PCR of gria4a, gria4b, gria2b, and ef1α mRNA at 48 hpf in wild-type, gria4a+/uva43, and gria4auva43/uva43 embryos. Ef1α was used as housekeeping gene.
Figure 2.
Figure 2.
Gria4a mutants have reduced dorsal OPC migration and altered OPC migration dynamics. A, B, Mean ± SEM of dorsal OPCs per somite in Tg(olig2:dsred);Tg(mbp:egfp-CAAX) gria4a+/+ (n = 6), gria4a+/uva43 (n = 21), and gria4auva43/uva43 (n = 9) embryos at 56 (p = 0.11) and 72 hpf (gria4a+/+ vs gria4auva43/uva43 p = 0.0041; gria4a+/uva43 vs gria4auva43/uva43 p = 0.0659). C, Mean ± SEM of net change in dorsal OPC number per somite in gria4a+/+ (n = 6), gria4a+/uva43 (n = 21), and gria4auva43/uva43 (n = 9) embryos between 56 and 72 hpf (gria4a+/+ vs gria4auva43/uva43 p = 0.0083; gria4a+/uva43 vs gria4auva43/uva43 p = 0.0013). D, E, Migration tracks of OPCs in Tg(olig2:dsred);Tg(mbp:egfp-CAAX) gria4a+/+ and gria4auva43/uva43 embryos between 56 and 72 hpf. Only fluorescence from Tg(olig2:dsred) line shown for clarity. F, G, Violin plots of OPC migration distance (gria4a+/+ vs gria4auva43/uva43 p = 0.0092; gria4a+/uva43 vs gria4auva43/uva43 p = 0.0105) and speed (gria4a+/+ vs gria4auva43/uva43 p = 0.0309) between 56 and 72 hpf in gria4a+/+ (n = 7), gria4a+/uva43 (n = 8), and gria4auva43/uva43 (n = 8) embryos. H, I, Mean ± SEM of dorsal olig2+ cell number per somite in gria4a+/+ (n = 9), gria4a+/uva43 (n = 8), and gria4auva43/uva43 (n = 11) larvae at 80 and 96 hpf. At 80 hpf, gria4a+/+ versus gria4auva43/uva43 p = 0.0030; gria4a+/uva43 versus gria4auva43/uva43 p = 0.0010. At 96 hpf, gria4a+/+ versus gria4auva43/uva43 p = 0.0008; gria4a+/uva43 versus gria4auva43/uva43 p = 0.00,513. J, Mean ± SEM of net change in dorsal olig2+ cell number per somite in gria4a+/+, gria4a+/uva43, and gria4auva43/uva43 larvae between 80 and 96 hpf; p = 0.0794 across all groups. K, L, Quantification of dorsal OPC proliferation (K) and cell death (L) from in vivo, time-lapse movies of wild-type (n = 7), heterozygous (n = 21), and mutant (n = 9) larvae between 56 and 72 hpf. ns = no significant differences between groups. Scale bar: 50 µm.
Figure 3.
Figure 3.
Treatment with ionotropic glutamate receptor inhibitor NBQX reduces dorsal OPC migration between 56 and 72 hpf. A, Brightfield images of 56-hpf gria4a wild-type and mutant embryos after treatment with DMSO or 40 μm NBQX. B, Representative images and tracing of OPC migration after treatment with 40 μm NBQX (scale bar: 50 µm). C–E, Mean ± SEM of dorsal OPCs per somite at 56 to 72 hpf in Tg(nkx2.2a:megfp);Tg(olig2:dsred) embryos treated with 40 μm NBQX in 1% DMSO or 1% DMSO alone from 30 to 72 hpf. C, Quantification of dorsal OPCs per somite in DMSO and NBQX-treated gria4a+/+ embryos and larvae at 56 and 72 hpf (DMSO n = 31, NBQX n = 30, DMSO vs NBQX at 72 hpf p = 0.0305). D, Quantification of dorsal OPCs per somite in DMSO and NBQX-treated gria4a+/uva43 embryos and larvae at 56 and 72 hpf (DMSO n = 12, NBQX n = 11, DMSO vs NBQX at 72 hpf p = 0.0663). E, Quantification of dorsal OPCs per somite in DMSO and NBQX-treated gria4auva43/uva43 embryos and larvae at 56 and 72 hpf (DMSO n = 18, NBQX n = 11, DMSO vs NBQX at 72hpf p = 0.0427). ns = no significant differences between groups.
Figure 4.
Figure 4.
gria4a mutant OPCs have a decreased ability to sense glutamate. A, Representative images of 56 hpf Tg(sox10:SF-iGluSnFr) embryos before and after photo-uncaging of MNI-glutamate (M-glut) by a 404-nm laser. Red circle indicates focal region of interest (ROI) where M-glut was uncaged, ∼20–40 µm from sox10+ OPC membranes. Yellow ROIs indicate where fluorescence intensity was measured on OPC membranes and cyan ROIs indicate size-matched regions where background fluorescence was measured next to the cell (n = 22 regions of n = 18 cells in n = 3 fish). Inset is magnified view of a SF-iGluSnFR+ cell fluorescence after M-glut uncaging. B, Representative quantification of the difference in fluorescence intensity (dFI) before and after MNI-glut uncaging of two different sox10+ cell membranes and size-matched ROIs in the background, averaged per 25 frames (800 ms) of imaging. C, Quantification of relative total dFI after uncaging of M-glut on sox10+ cell membranes compared with the size-matched regions in the background (n = 22, p < 0.0001). D, Representative image of ROI (yellow, 50 µm2) in the spinal cord where M-glut was uncaged in Tg(olig2:dsred) embryos at 56 hpf for data collected in D, E. E, F, Violin plots of OPC migration speed and distance in gria4a+/+ (DMSO n = 9, M-glut n = 6), gria4a+/uva43 (M-glut n = 12), and gria4auva43/uva43 (DMSO n = 6, M-glut n = 15) larvae after uncaging of M-glut (1 μm) over a time course of 2 h. Migration speed across all groups p < 0.0001, gria4a+/+ DMSO versus gria4a+/+ M-glut p = 0.0048, gria4a+/+ M-glut versus gria4a+/uva43 M-glut p = 0.0018, gria4a+/+ M-glut versus gria4auva43/uva43 M-glut p < 0.0001. Migration distance across all groups p < 0.0001, gria4a+/+ DMSO versus gria4a+/+ M-glut p = 0.0094, gria4a+/+ M-glut versus gria4a+/uva43 M-glut p = 0.0012, gria4a+/+ M-glut versus gria4auva43/uva43 M-glut p < 0.0001. ns = no significant differences between groups. Scale bars: 50 µm.
Figure 5.
Figure 5.
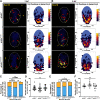
gria4a mutants have altered OLC distribution, but not total number. A, B, Heatmaps and representative images of Sox10 antibody labeling and DAPI staining in 3- and 6-dpf spinal cord sections from gria4a+/+ (3 dpf n = 20, 6 dpf n = 10), gria4a+/uva43 (3 dpf n = 21, 6 dpf n = 10), and gria4auva43/uva43 (3 dpf n = 20, 6 dpf n = 10) larvae. Red arrowheads denote Sox10+ OLCs. Dashed circle delineates the edge of the spinal cord. In accompanying panels for each genotype and age, we plot the data as a heatmap, with warmer colors representing higher numbers of Sox10+ cells. Blue ovals represent an average of the size of all transverse spinal cord sections analyzed, and each hexagon represents a Sox10+ cell counted. Caution was taken to only count cells within the spinal cord boundary for each section, and points on the heatmap that fall outside of the average blue oval spinal cord were in fact, located in the spinal cord in the actual section they were quantified. C, E, Quantification of Sox10+ cells in the ventral and dorsal spinal cord at 3 dpf (gria4a+/+ vs gria4auva43/uva43 p = 0.0080; gria4a+/+ vs gria4a+/uva43 p = 0.0478) and 6 dpf (gria4a+/+ vs gria4auva43/uva43 p = 0.0159). D, F, Quantification of the number of Sox10+ cells per section in each genotype at 3 and 6 dpf. ns = no significant differences between groups. Scale bars: 50 µm.
Figure 6.
Figure 6.
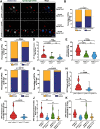
Mutation of gria4a alters OLC migration in a cell-autonomous manner. A, Genetic mosaic embryos with Tg(mbp:egfp-CAAX);gria4a+/+ and gria4auva43/uva43 cells transplanted into gria4a+/+ embryos, with mbp+/dextran+ OPCs marked with red arrowheads and mbp-/dextran+ cells marked with open red arrowheads. Dashed lines denote the boundary of the ventral spinal cord. B, C, Quantification of the number of transplanted OLCs in the dorsal versus ventral spinal cord for gria4a+/+ (n = 21 at 56 hpf and 18 at 72 hpf) and gria4auva43/uva43 (n = 27 at 56 hpf and 25 at 72hpf) OPCs transplanted into gria4a+/+ embryos; p = 0.0417 at 56 hpf, p = 0.0003 at 72 hpf. D, E, Migration speed (gria4a+/+ vs gria4auva43/uva43 p < 0.0001; gria4a+/+ vs gria4a+/uva43 p = 0.0783) and distance traveled (gria4a+/+ vs gria4auva43/uva43 p < 0.0001; gria4a+/+ vs gria4a+/uva43 p = 0.0011) of OLCs transplanted into gria4a+/+ embryos between 56 and 72 hpf. F, G, Percentage of transplanted OLCs in the dorsal versus ventral spinal cord when gria4a+/+ (n = 18) and gria4auva43/uva43 (n = 18) OLCs were transplanted into gria4auva43/uva43 embryos at 56 (p = 0.0191) and 72 hpf (p = 0.0133). H, Migration speed of OLCs transplanted into gria4auva43/uva43 embryos between 56 and 72 hpf; p = 0.0005. I, Migration distance of OLCs transplanted into gria4auva43/uva43 embryos between 56 and 72 hpf; p = 0.0215. J, Comparison of migration speed of gria4a+/+ and gria4auva43/uva43 OLCs transplanted into gria4a+/+ and gria4auva43/uva43 embryos between 56 and 72 hpf; p = 0.4745 for gria4a+/+ into gria4auva43/uva43 versus gria4a+/+ into gria4a+/+, p = 0.7859 for gria4auva43/uva43 into gria4auva43/uva43 versus gria4auva43/uva43 into gria4a+/+. K, Comparison of migration distance of gria4a+/+ and gria4auva43/uva43 OLCs transplanted into gria4a+/+ and gria4auva43/uva43 embryos between 56 and 72 hpf; p = 0.6566 for gria4a+/+ into gria4auva43/uva43 versus gria4a+/+ into gria4a+/+, p =0.2511 for gria4auva43/uva43 into gria4auva43/uva43 versus gria4auva43/uva43 into gria4a+/+. ns = no significant differences between groups. Scale bar: 50 µm.
Figure 7.
Figure 7.
Dorsal spinal cord myelination is reduced in gria4auva43/uva43 larvae at 3 dpf. A, Myelin expression marked by Tg(mbp:egfp-CAAX) in gria4a+/+ (n = 11), gria4a+/uva43 (n = 12), and gria4auva43/uva43 (n = 6) larvae at 3 dpf, with myelin internodes labeled by red arrowheads. Yellow arrowheads denote normal peripheral myelin along spinal motor nerve roots. B, Mean ± SEM of the number of dorsal myelin internodes per somite at 3 dpf in each genotype, measured in z-stack; p = 0.0003 across all groups (gria4a+/+ vs gria4auva43/uva43 p = 0.0012; gria4a+/+ vs gria4a+/uva43 p = 0.0016). C, Quantification of the average myelin internode length for each genotype at 3 dpf. D, E, Mean ± SEM of the number (D) and average length (E) of dorsal myelin internodes per somite at 3 dpf in Tg(mbp:egfp-CAAX) larvae treated with 40 μm NBQX in 1% DMSO or 1% DMSO alone from 55 to 80 hpf. gria4a+/+ n = 22 and 25, gria4a+/uva43 n = 22 and 23 and gria4auva43/uva43 n = 21 and 26, for DMSO or NBQX-treated larvae, respectively. gria4auva43/uva43 number of internodes p = 0.0347, average internode length p = 0.0497. ns = no significant differences between groups. Scale bar: 25 µm.
Figure 8.
Figure 8.
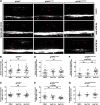
gria4auva43/uva43 larvae have less dorsal myelin at 5 dpf, but more internodes per cell. A, Myelin expression marked by Tg(mbp:egfp-CAAX) in gria4a+/+ (n = 8), gria4a+/uva43 (n = 8), and gria4auva43/uva43 (n = 7) larvae at 5 dpf, with myelin internodes labeled by red arrowheads. Yellow arrowheads denote normal peripheral myelin along spinal motor nerve roots. B, Mean ± SEM of the number of myelin internodes per somite at 5 dpf in each genotype in a single z-plane with the most myelin internodes visible (gria4a+/+ vs gria4auva43/uva43 p < 0.0001; gria4a+/uva43 vs gria4auva43/uva43 p = 0.0027). C, Mean ± SEM of the average myelin internode length for each genotype at 5 dpf. D, Representative images of myelin expression by individual oligodendrocytes marked by transient injections of the mbp:egfp-CAAX construct in gria4a+/+ (ventral n = 25 cells in n = 8 larvae; dorsal n = 14 cells in n = 6 larvae), gria4a+/uva43 (ventral n = 31 cells in n = 13 larvae; dorsal n = 10 cells in n = 9 larvae), and gria4auva43/uva43 (ventral n = 30 cells in n = 9 larvae; dorsal n = 14 cells in n = 4 larvae) at 5 dpf. E, F, Mean ± SEM of the number (E) and average length (F; gria4a+/+ vs gria4auva43/uva43 p = 0.0188) of ventral myelin internodes per somite at 5 dpf in each genotype. G, H, Mean ± SEM of the number (G) and average length (H) of dorsal myelin internodes per somite at 5 dpf in each genotype. ns = no significant differences between groups. Scale bars: 25 µm (A) and 50 µm (D).
Figure 9.
Figure 9.
Activation of voltage-gated Ca2+ channels restore normal OPC migration in gria4auva43/uva43 larvae. A, Brightfield images of 80-hpf gria4a wild-type and mutant larvae after treatment with 5 μm voltage-gated calcium channel agonist (±)-Bay K 8644. B, Mean ± SEM of the number of dorsal OPCs per somite in gria4a+/+ and gria4auva43/uva43 embryos at 56 hpf following treatment with either 5 μm (±)-Bay K 8644 (gria4a+/+ n = 15, gria4auva43/uva43 n = 22) in 1% DMSO or 1% DMSO control (gria4a+/+ n = 6, gria4auva43/uva43 n = 15); p = 0.4721. C, Mean ± SEM of the number of dorsal OPCs per somite in gria4a+/+ and gria4auva43/uva43 larvae at 72 hpf following treatment with either 5 μm (±)-Bay K 8644 in 1% DMSO or 1% DMSO control. p < 0.0001 across all groups, p = 0.5983 for gria4auva43/uva43 + (±)-Bay K 8644 versus gria4a+/+ + (±)-Bay K 8644, p = 0.0008 for gria4auva43/uva43 + DMSO versus gria4a+/+ + DMSO, and p < 0.0001 for gria4auva43/uva43 + (±)-Bay K 8644 versus gria4auva43/uva43 + DMSO. D, Model of mechanism through which GluR4A works with voltage-gated calcium channels to regulate OPC migration. ns = no significant differences between groups. Scale bar: 1 mm.
Figure 10.
Figure 10.
Activation of voltage-gated Ca2+ channels restore myelination after in gria4auva43/uva43 larvae. A, Representative images of myelin expression marked by Tg(mbp:egfp-CAAX) in gria4a+/+ (n = 14–22), gria4a+/uva43 (n = 13–22), and gria4auva43/uva43 (n = 14–20) larvae at 3 dpf. Myelin internodes are labeled by red arrowheads. Yellow arrowheads denote normal peripheral myelin along spinal motor nerve roots. B, D, F, Mean ± SEM of the number of dorsal myelin internodes per somite at 3 dpf in gria4a+/+ (B), gria4a+/uva43 (D), and gria4auva43/uva43 (F; DMSO vs BayK 24 h p = 0.0192). C, E, G, Quantification of the average myelin internode length for at 3 dpf in gria4a+/+ (C), gria4a+/uva43 (E; DMSO vs BayK 24 h p = 0.0371), and gria4auva43/uva43 (G). ns = no significant differences between groups. Scale bar: 25 µm.

Similar articles

Cited by

References

    1. Almeida RG, Czopka T, Ffrench-Constant C, Lyons DA (2011) Individual axons regulate the myelinating potential of single oligodendrocytes in vivo. Development 138:4443–4450. 10.1242/dev.071001 - DOI - PMC - PubMed
    1. Baraban M, Koudelka S, Lyons DA (2018) Ca 2+ activity signatures of myelin sheath formation and growth in vivo. Nat Neurosci 21:19–23. 10.1038/s41593-017-0040-x - DOI - PMC - PubMed
    1. Barres BA, Raff MC (1993) Proliferation of oligodendrocyte precursor cells depends on electrical activity in axons. Nature 361:258–260. 10.1038/361258a0 - DOI - PubMed
    1. Barres BA, Raff MC (1999) Axonal control of oligodendrocyte development. J Cell Biol 147:1123–1128. 10.1083/jcb.147.6.1123 - DOI - PMC - PubMed
    1. Bechler ME, Swire M, Ffrench-Constant C (2018) Intrinsic and adaptive myelination-A sequential mechanism for smart wiring in the brain. Dev Neurobiol 78:68–79. 10.1002/dneu.22518 - DOI - PMC - PubMed

MeSH terms

LinkOut - more resources