Rap1 in the VMH regulates glucose homeostasis
- PMID: 33974562
- PMCID: PMC8262364
- DOI: 10.1172/jci.insight.142545
Rap1 in the VMH regulates glucose homeostasis
Abstract
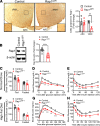
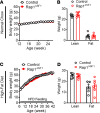
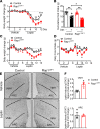
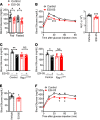
The hypothalamus is a critical regulator of glucose metabolism and is capable of correcting diabetes conditions independently of an effect on energy balance. The small GTPase Rap1 in the forebrain is implicated in high-fat diet-induced (HFD-induced) obesity and glucose imbalance. Here, we report that increasing Rap1 activity selectively in the medial hypothalamus elevated blood glucose without increasing the body weight of HFD-fed mice. In contrast, decreasing hypothalamic Rap1 activity protected mice from diet-induced hyperglycemia but did not prevent weight gain. The remarkable glycemic effect of Rap1 was reproduced when Rap1 was specifically deleted in steroidogenic factor-1-positive (SF-1-positive) neurons in the ventromedial hypothalamic nucleus (VMH) known to regulate glucose metabolism. While having no effect on body weight regardless of sex, diet, and age, Rap1 deficiency in the VMH SF1 neurons markedly lowered blood glucose and insulin levels, improved glucose and insulin tolerance, and protected mice against HFD-induced neural leptin resistance and peripheral insulin resistance at the cellular and whole-body levels. Last, acute pharmacological inhibition of brain exchange protein directly activated by cAMP 2, a direct activator of Rap1, corrected glucose imbalance in obese mouse models. Our findings uncover the primary role of VMH Rap1 in glycemic control and implicate Rap1 signaling as a potential target for therapeutic intervention in diabetes.
Keywords: G proteins; Glucose metabolism; Metabolism; Neuroscience; Signal transduction.
Conflict of interest statement
Figures


Similar articles
-
Neuronal Rap1 Regulates Energy Balance, Glucose Homeostasis, and Leptin Actions.Cell Rep. 2016 Sep 13;16(11):3003-3015. doi: 10.1016/j.celrep.2016.08.039. Cell Rep. 2016. PMID: 27626668 Free PMC article.
-
Steroidogenic Factor 1 in the Ventromedial Nucleus of the Hypothalamus Regulates Age-Dependent Obesity.PLoS One. 2016 Sep 6;11(9):e0162352. doi: 10.1371/journal.pone.0162352. eCollection 2016. PLoS One. 2016. PMID: 27598259 Free PMC article.
-
Disrupted Leptin Signaling in the Lateral Hypothalamus and Ventral Premammillary Nucleus Alters Insulin and Glucagon Secretion and Protects Against Diet-Induced Obesity.Endocrinology. 2016 Jul;157(7):2671-85. doi: 10.1210/en.2015-1998. Epub 2016 May 16. Endocrinology. 2016. PMID: 27183315
-
SF-1 in the ventral medial hypothalamic nucleus: a key regulator of homeostasis.Mol Cell Endocrinol. 2011 Apr 10;336(1-2):219-23. doi: 10.1016/j.mce.2010.11.019. Epub 2010 Nov 24. Mol Cell Endocrinol. 2011. PMID: 21111025 Free PMC article. Review.
-
New Insights of SF1 Neurons in Hypothalamic Regulation of Obesity and Diabetes.Int J Mol Sci. 2021 Jun 8;22(12):6186. doi: 10.3390/ijms22126186. Int J Mol Sci. 2021. PMID: 34201257 Free PMC article. Review.
Cited by
-
Predicting gestational diabetes mellitus risk at 11-13 weeks' gestation: the role of extrachromosomal circular DNA.Cardiovasc Diabetol. 2024 Aug 7;23(1):289. doi: 10.1186/s12933-024-02381-1. Cardiovasc Diabetol. 2024. PMID: 39113025 Free PMC article.
-
Downregulating miR-184 relieves calcium oxalate crystal-mediated renal cell damage via activating the Rap1 signaling pathway.Aging (Albany NY). 2023 Dec 27;15(24):14749-14763. doi: 10.18632/aging.205286. Epub 2023 Dec 27. Aging (Albany NY). 2023. PMID: 38154105 Free PMC article.
-
Exploring the molecular mechanism underlying the psoriasis and T2D by using microarray data analysis.Sci Rep. 2023 Nov 7;13(1):19313. doi: 10.1038/s41598-023-46795-5. Sci Rep. 2023. PMID: 37935955 Free PMC article.
-
Ventromedial hypothalamic OGT drives adipose tissue lipolysis and curbs obesity.Sci Adv. 2022 Sep 2;8(35):eabn8092. doi: 10.1126/sciadv.abn8092. Epub 2022 Aug 31. Sci Adv. 2022. PMID: 36044565 Free PMC article.
-
Leptin signaling and its central role in energy homeostasis.Front Neurosci. 2023 Oct 31;17:1238528. doi: 10.3389/fnins.2023.1238528. eCollection 2023. Front Neurosci. 2023. PMID: 38027481 Free PMC article. Review.
References
-
- Bernard C De l’origine du sucre dans l’économie animale. Société de biologie (Paris, France) 1848:3–19.
-
- Lam CK, et al. CNS regulation of glucose homeostasis. Physiology (Bethesda) 2009;24:159–170. - PubMed
Publication types
MeSH terms
Substances
Grants and funding
LinkOut - more resources
Full Text Sources
Other Literature Sources
Medical
Molecular Biology Databases

