. 2021 May 10;4(1):544.
doi: 10.1038/s42003-021-02054-9.

ARP-T1-associated Bazex-Dupré-Christol syndrome is an inherited basal cell cancer with ciliary defects characteristic of ciliopathies

Affiliations

ARP-T1-associated Bazex-Dupré-Christol syndrome is an inherited basal cell cancer with ciliary defects characteristic of ciliopathies

Hyun-Sook Park et al. Commun Biol. .

Abstract

Actin-Related Protein-Testis1 (ARP-T1)/ACTRT1 gene mutations cause the Bazex-Dupré-Christol Syndrome (BDCS) characterized by follicular atrophoderma, hypotrichosis, and basal cell cancer. Here, we report an ARP-T1 interactome (PXD016557) that includes proteins involved in ciliogenesis, endosomal recycling, and septin ring formation. In agreement, ARP-T1 localizes to the midbody during cytokinesis and the basal body of primary cilia in interphase. Tissue samples from ARP-T1-associated BDCS patients have reduced ciliary length. The severity of the shortened cilia significantly correlates with the ARP-T1 levels, which was further validated by ACTRT1 knockdown in culture cells. Thus, we propose that ARP-T1 participates in the regulation of cilia length and that ARP-T1-associated BDCS is a case of skin cancer with ciliopathy characteristics.


Conflict of interest statement

The authors declare no competing interests.

Figures

Fig. 1
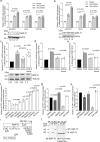
Fig. 1. ARP-T1 is expressed during epidermal and epithelial differentiation.
a, c, e, g mRNA expression of ACTRT1 during differentiation of keratinocytes, NHEK (a N = 5) and HaCaT (c N = 3), and epithelial cells, ARPE19 (e N = 3) and hTERT-RPE1 (g N = 5). Data are presented as means of the fold change compared to the value of undifferentiated samples. Each open circle represents one independent experiment. b, d, f, h Representative images of ARP-T1 expression during differentiation of keratinocytes, NHEK (b) and HaCaT (d), and epithelial cells, ARPE19 (f) and hTERT-RPE1 (h). ARP-T1 was detected using guinea pig anti-ARP-T1 antisera (b) or mouse antibody (d, f, h). * indicates polymers of ARP-T1 confirmed by mass spectrometry analysis. Keratin 10 and IFT88 were used as markers of cell differentiation in keratinocytes and epithelial cells, respectively, actin and tubulin as loading controls.
Fig. 2
Fig. 2. ACTRT1 is regulated by non-canonical Hedgehog signaling pathway and by protein kinase C delta.
a, b Relative ACTRT1, GLI1, and PTCH1 mRNA expression (a, b N = 6) and ARP-T1 expression (a N = 4; b N = 3) upon treatment with SAG in hTERT-RPE1 cells under proliferative (a) and differentiating (b) conditions. Actin is used as loading control for ARP-T1 expression. Numbers under the blots present the fold change expression of ARP-T1 compared to the vehicle (DMSO) treatment. ce Relative ACTRT1 (c N = 7), GLI1 (d N = 4), PTCH1 (e N = 3) mRNA expression and ARP-T1 expression (c N = 4) upon treatment with purmorphamine (PUR) and/or vismodegib (VISMO) in differentiated hTERT-RPE1 cells. Tubulin is used as loading control for ARP-T1 expression. Numbers beneath the blots represent the fold change expression of ARP-T1 compared to the vehicle treatment. f, g Relative ACTRT1 mRNA expression upon treatment with different protein kinase inhibitors (f) or with PKC inhibitors (g) in differentiated NHEK (N = 3). h Relative ACTRT1 mRNA expression upon treatment with PKC inhibitors in differentiated HaCaT cells (N = 3). ah Data are presented as means of the fold change compared to the value of vehicle-treated samples. Each open circle represents one independent experiment. i Schematic representation of ARP-T1 and ARP-T1 mutant (547_548insA) with predicted phosphorylation sites. j ARP-T1 and Phospho-Serine (P-Ser) PKC expression in NHEK transduced with lentiviral vectors, empty vector (V), ACTRT1 mutant (M), and ACTRT1 WT (WT), after immunoprecipitated (IP) with anti-FLAG monoclonal antibody M2-conjugated agarose.
Fig. 3
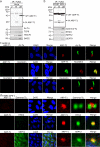
Fig. 3. ARP-T1 interacts with proteins involved in ciliary machinery.
a, b HeLa (a) and hTERT-RPE1 (b) cells were transduced with lentiviral vectors, empty vector (V), ACTRT1 mutant (M) and ACTRT1 WT (WT), and immunoprecipitated (IP) with anti-FLAG monoclonal antibody M2-conjugated agarose, and analyzed by immunoblot with indicated antisera. c Immunofluorescence stainings of ARP-T1, acetylated-tubulin and rootletin in 35 days of serum-starved ARPE19 cells. Nuclei are stained with DAPI. Scale bar, 5 µm. Higher magnifications of the boxed area are shown on right three panels. Scale bar, 1 µm. d Immunofluorescence staining of ARP-T1, gamma-tubulin, EHD4, and septin 2 in 48 h of serum-starved hTERT-RPE1 cells. Nuclei are stained with DAPI. Scale bar, 5 µm. Higher magnifications of the boxed area are shown on the right three panels. Scale bar, 1 µm.
Fig. 4
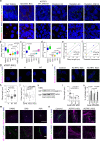
Fig. 4. The Bazex–Dupré–Christol syndrome is a ciliopathy caused by ARP-T1 loss of function, and knockdown of ACTRT1 in hTERT-RPE1 cells induces resorption of primary cilia.
a Representative immunofluorescence images using acetylated-tubulin (green) and rootletin (red) (top), and ARP-T1 (green) and rootletin (red) (bottom) in hair follicle, sporadic BCC and 4 BDCS (ACTRT1 547_548insA, mutation B2, mutation A3, mutation CNE12). Cell nuclei are stained with DAPI (blue). Scale bar, 5 µm. b Quantification of the ciliary length from 3D confocal immunofluorescence microscopy images. c, d Quantification of the relative fluorescence intensity of rootletin (c N = 5) and ARP-T1 (d N = 10) on the ciliary rootlet. e, f Correlation between the ARP-T1 fluorescence and ciliary length (e), and between the ARP-T1 and rootletin fluorescence (f). g Immunofluorescence stainings of acetylated-tubulin (green) and rootletin (pink) in 48 h serum starved hTERT-RPE1 cells expressing an empty vector (V), or ACTRT1 mutant (M), or ACTRT1 WT (WT). Cell nuclei are stained with DAPI (blue). Scale bar, 10 µm. h Quantification of ciliary length of (g). i Immunofluorescence stainings of acetylated-tubulin (green) and rootletin (pink) in 48 h serum-starved control and ACTRT1 KD hTERT-RPE1 cells. Cell nuclei are stained with DAPI (blue). Scale bar, 10 µm. j, k Quantification of the ciliary length (j) and ARP-T1 protein level (k N = 3) in control (Cont.) and ACTRT1 KD hTERT-RPE1 cells. l Quantification of ciliary length in 48 h serum-starved control and ACTRT1 KD hTERT-RPE1 cells expressing an empty vector (V), or ACTRT1 mutant resistant to shRNA (MshR). bd, h, j, l Results are presented as Tukey box-plot. Black circles represent outliers. m Representative immunofluorescence stainings of ARP-T1 (pink) and rootletin (green, top) or septin 2 (green, bottom) upon treatment with SAG or purmorphamine (PUR) in hTERT-RPE1 cells under differentiating condition. Scale bar, 5 µm (top) or 1 µm (bottom). n Immunofluorescence stainings of acetylated-tubulin (green) and septin 9 (pink, top) or septin 2 (pink, bottom) in 48 h serum-starved control and ACTRT1 KD hTERT-RPE1 cells. Scale bar, 1 µm. o Percentage of ciliated control and ACTRT1 KD hTERT-RPE1 cells under proliferative condition, after treatment with cytochalasin D (CytD). Data are presented as means of the percentage ± SD.
Fig. 5
Fig. 5. ARP-T1 localizes to midbody during cytokinesis.
a Immunofluorescence stainings of ARP-T1 (red) and acetylated-tubulin (green) in hTERT-RPE1 cells. Cell nuclei are stained with DAPI (blue). b Immunofluorescence stainings of ARP-T1 (green) and acetylated-tubulin (red) in HeLa cells. Cell nuclei are stained with DAPI (blue). c Immunofluorescence stainings of ARP-T1 (red) and acetylated-tubulin (green) in HaCaT cells. Cell nuclei are stained with DAPI (blue). d, e Proliferation (d) and apoptosis (e) analyses of control (Cont.) and ACTRT1 KD hTERT-RPE1 cells. Data are presented as means of the percentage. Each open circle represents one independent experiment. fi Model for ARP-T1 traveling from midbody to the primary cilium.

Similar articles

Cited by

References

    1. Bazex, A., Dupre, A. & Christol, B. [Follicular atrophoderma, baso-cellular proliferations and hypotrichosis]. Annal. Dermatologie Syphiligraphie93, 241–254 (1966). - PubMed
    1. Parren LJ, Frank J. Hereditary tumour syndromes featuring basal cell carcinomas. Br. J. Dermatol. 2011;165:30–34. doi: 10.1111/j.1365-2133.2011.10334.x. - DOI - PubMed
    1. Vabres P, et al. The gene for Bazex–Dupre–Christol syndrome maps to chromosome Xq. J. investigative Dermatol. 1995;105:87–91. doi: 10.1111/1523-1747.ep12313359. - DOI - PubMed
    1. Abuzahra F, Parren LJ, Frank J. Multiple familial and pigmented basal cell carcinomas in early childhood—Bazex-Dupre-Christol syndrome. J. Eur. Acad. Dermatol. Venereology. 2012;26:117–121. doi: 10.1111/j.1468-3083.2011.04048.x. - DOI - PubMed
    1. Castori M, Castiglia D, Passarelli F, Paradisi M. Bazex–Dupre–Christol syndrome: an ectodermal dysplasia with skin appendage neoplasms. Eur. J. Med. Genet. 2009;52:250–255. doi: 10.1016/j.ejmg.2008.12.003. - DOI - PubMed

Publication types

MeSH terms

Substances

Supplementary concepts