. 2021 May 10;12(1):2592.
doi: 10.1038/s41467-021-22800-1.

Decoupling epithelial-mesenchymal transitions from stromal profiles by integrative expression analysis

Affiliations

Decoupling epithelial-mesenchymal transitions from stromal profiles by integrative expression analysis

Michael Tyler et al. Nat Commun. .

Abstract

Epithelial-to-mesenchymal transition (EMT) is the most commonly cited mechanism for cancer metastasis, but it is difficult to distinguish from profiles of normal stromal cells in the tumour microenvironment. In this study we use published single cell RNA-seq data to directly compare mesenchymal signatures from cancer and stromal cells. Informed by these comparisons, we developed a computational framework to decouple these two sources of mesenchymal expression profiles using bulk RNA-seq datasets. This deconvolution offers the opportunity to characterise EMT across hundreds of tumours and examine its association with metastasis and other clinical features. With this approach, we find three distinct patterns of EMT, associated with squamous, gynaecological and gastrointestinal cancer types. Surprisingly, in most cancer types, EMT patterns are not associated with increased chance of metastasis, suggesting that other steps in the metastatic cascade may represent the main bottleneck. This work provides a comprehensive evaluation of EMT profiles and their functional significance across hundreds of tumours while circumventing the confounding effect of stromal cells.


Conflict of interest statement

The authors declare no competing interests.

Figures
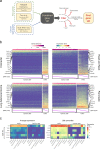
Fig. 1
Fig. 1. Expression of ESGs in cancer cells and CAFs by scRNA-seq.
a Scheme depicting the gene selection and filtering process for defining cancer type-specific lists of EMT signature genes (ESGs). b Heatmaps showing expression levels of ESGs (rows) in cancer cells and CAFs (columns) in 4 scRNA-seq datasets (panels) out of the 8 considered (the remaining 4 are shown in Fig. S4). Columns (cells) are ordered by their EMT scores (see Methods), which are shown in the line graphs below the heatmaps. The bar above each heatmap shows the number of genes detected in each cell. c Heatmaps showing the average and 95th percentile of the expression levels of each of the core EMT TFs and Vimentin in cancer cells and CAFs in each of the 8 scRNA-seq datasets.
Fig. 2
Fig. 2. Contribution of different cell types to expression of ESGs in simulated bulk tumours.
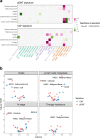
a Line plots showing the relative contributions of different cell types to ESG expression (EMT signal), for various fractions of tumour composition, in simulated bulk expression profiles based on 3 scRNA-seq datasets out of the 8 considered (the remaining 5 are shown in Fig. S8a). Each point represents the average proportion of EMT signature gene expression coming from the corresponding cell type in a collection of 100 simulated tumours with the given fraction of that cell type and varying proportions of the other cell types. Error bars show the standard deviation over the set of 100 simulations. b ESG co-expression matrices derived from simulated bulk expression profiles based on the 3 scRNA-seq datasets shown in (a) (the remaining 5 are shown in Fig. S8b), ordered by the SPIN side-to-side algorithm with slight modifications (see Methods). ESGs are annotated with two colour-coded panels at the top: (1) correlations with simulated tumour purity (Pearson correlation coefficient); and (2) comparison of expression levels in simulated tumours versus in cell lines, where positive numbers indicate higher expression in tumours than in cell lines. Heatmaps below the co-expression matrices show the relative expression levels of ESGs in individual CAFs (bottom rows) and cancer cells (top rows) in the scRNA-seq data. Selected ESGs are labelled at the side of each co-expression matrix. Source data are provided as a Source Data file.
Fig. 3
Fig. 3. Deconvolution of cancer and CAF ESG expression from TCGA bulk expression profiles.
a ESG co-expression matrices derived from TCGA bulk expression data for 3 cancer types of the 24 considered (the remainder are shown in Fig. S10), ordered by the SPIN STS algorithm with slight modifications (see Methods). ESGs are annotated with two colour-coded panels at the top: (1) Pearson correlations with estimates of tumour purity computed by ABSOLUTE; and (2) comparison of expression levels in tumours versus in cell lines, where positive numbers indicate higher expression in tumours than in cell lines. Heatmaps below the co-expression matrices show the relative expression levels of ESGs in individual CAFs (bottom rows) and cancer cells (top rows) in the relevant scRNA-seq dataset. Selected ESGs are labelled at the side of each co-expression matrix. Source data are provided as a Source Data file. b Table of cancer types corresponding to the TCGA disease codes. c Summary scatterplot of the deconvolution results for the 18 cancer types having accompanying scRNA-seq data, showing the difference in average relative expression levels of the top 20 pEMT genes (X-axis) and the top 20 CAF genes (Y-axis) between cancer cells and CAFs. Positive values indicate higher expression in cancer cells and negative values indicate higher expression in CAFs. d Summary scatterplot of the deconvolution results for all 24 cancer types examined, showing for each cancer type the average correlations among genes from the same cluster of ESGs (within-cluster, Y-axis) and between genes from the two different clusters of ESGs (between-cluster, X-axis).
Fig. 4
Fig. 4. Variability of ESG association with cancer cells and CAFs across cancer types/subtypes.
a Volcano plot showing each gene’s average pEMT-CAF score (X-axis) and its significance (Y-axis, quantified as -log10(p-value) based on two-sided T-test, without adjustment for multiple comparisons). Shown are all ESGs included in the TCGA deconvolution analysis, and selected ESGs are labelled. Source data are provided as a Source Data file. b Heatmap showing hierarchical clustering of pairwise correlations between cancer types/subtypes based on their pEMT-CAF scores for the 100 genes most commonly appearing in the inferred pEMT signatures, annotated by two coloured bars on each axis: (1) the silhouette of each cancer type with respect to the three largest clusters; and (2) the final cluster assignments after identifying intermediates. c Heatmap of pEMT-CAF scores for the top 20 differentially expressed pEMT genes in each of the three cancer type clusters. Both axes are ordered by hierarchical clustering. Source data are provided as a Source Data file.
Fig. 5
Fig. 5. Association of pEMT and CAF signatures with clinical features.
a Heatmaps showing the significance (quantified as –log10(p-value) based on a two-sided Wilcoxon rank-sum test, without adjustment for multiple comparisons) of the association of signatures for pEMT (top) and CAFs (bottom) with seven clinical features (rows) reflecting worse prognosis, in 23 of the 24 cancer types (columns) passing quality control (the LUSC Secretory subtype is absent due to low sample size). Positive and negative associations are depicted in purple and green, respectively. The cancer types are ordered by hierarchical clustering of their pEMT-CAF scores, and coloured by their pEMT cluster assignments. b Volcano plots showing, for each of four clinical features, the significance (Y-axis, defined as in a) of its association with pEMT signatures (red) and with CAF signatures (blue) against the effect size (X-axis, quantified as the difference in signature score). Points are labelled with their corresponding cancer types if they pass an adjusted significance threshold corresponding to an FDR of 0.05. Source data are provided as a Source Data file.

Similar articles

Cited by

References

    1. Dongre A, Weinberg RA. New insights into the mechanisms of epithelial–mesenchymal transition and implications for cancer. Nat. Rev. Mol. Cell Biol. 2019;20:69–84. doi: 10.1038/s41580-018-0080-4. - DOI - PubMed
    1. Nieto MA, Huang RY-J, Jackson RA, Thiery JP. EMT: 2016. Cell. 2016;166:21–45. doi: 10.1016/j.cell.2016.06.028. - DOI - PubMed
    1. Pastushenko I, Blanpain C. EMT transition states during tumor progression and metastasis. Trends Cell Biol. 2019;29:212–226. doi: 10.1016/j.tcb.2018.12.001. - DOI - PubMed
    1. Kudo-Saito C, Shirako H, Takeuchi T, Kawakami Y. Cancer metastasis is accelerated through immunosuppression during snail-induced EMT of cancer cells. Cancer Cell. 2009;15:195–206. doi: 10.1016/j.ccr.2009.01.023. - DOI - PubMed
    1. Fischer KR, et al. Epithelial-to-mesenchymal transition is not required for lung metastasis but contributes to chemoresistance. Nature. 2015;527:472–476. doi: 10.1038/nature15748. - DOI - PMC - PubMed

Publication types

MeSH terms

LinkOut - more resources