. 2021 Apr 30;30(2):120-143.
doi: 10.5607/en21004.

Tumor Spheroids of an Aggressive Form of Central Neurocytoma Have Transit-Amplifying Progenitor Characteristics with Enhanced EGFR and Tumor Stem Cell Signaling

Affiliations

Tumor Spheroids of an Aggressive Form of Central Neurocytoma Have Transit-Amplifying Progenitor Characteristics with Enhanced EGFR and Tumor Stem Cell Signaling

Hye Young Shin et al. Exp Neurobiol. .

Abstract

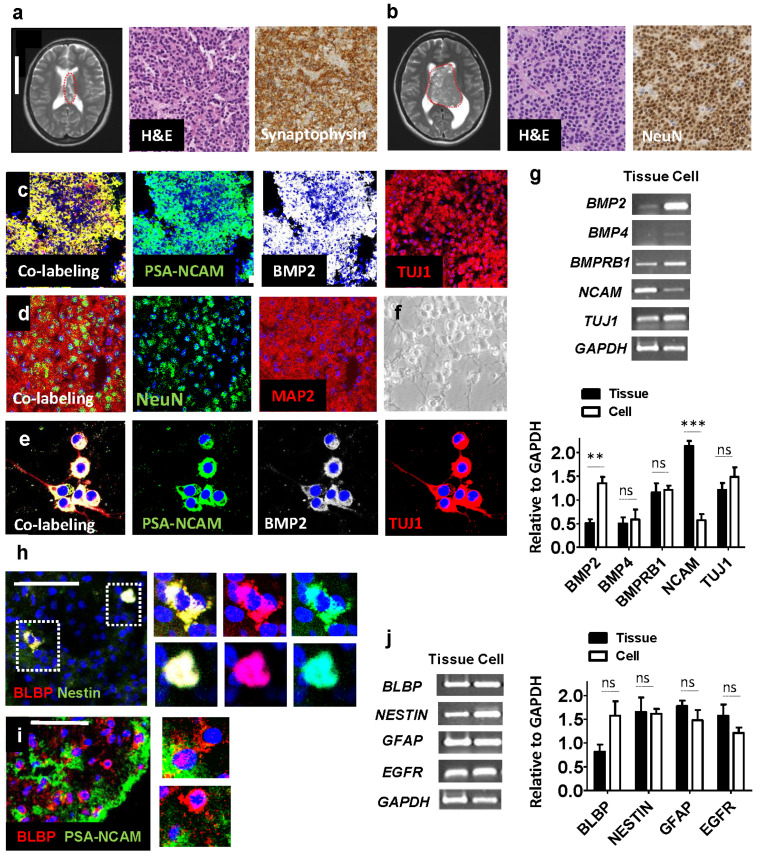
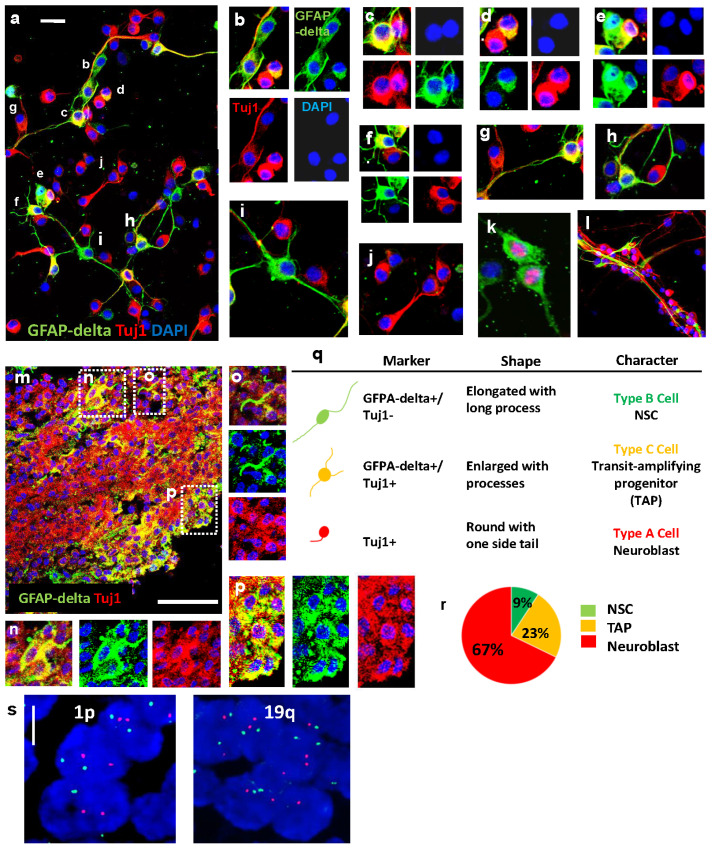
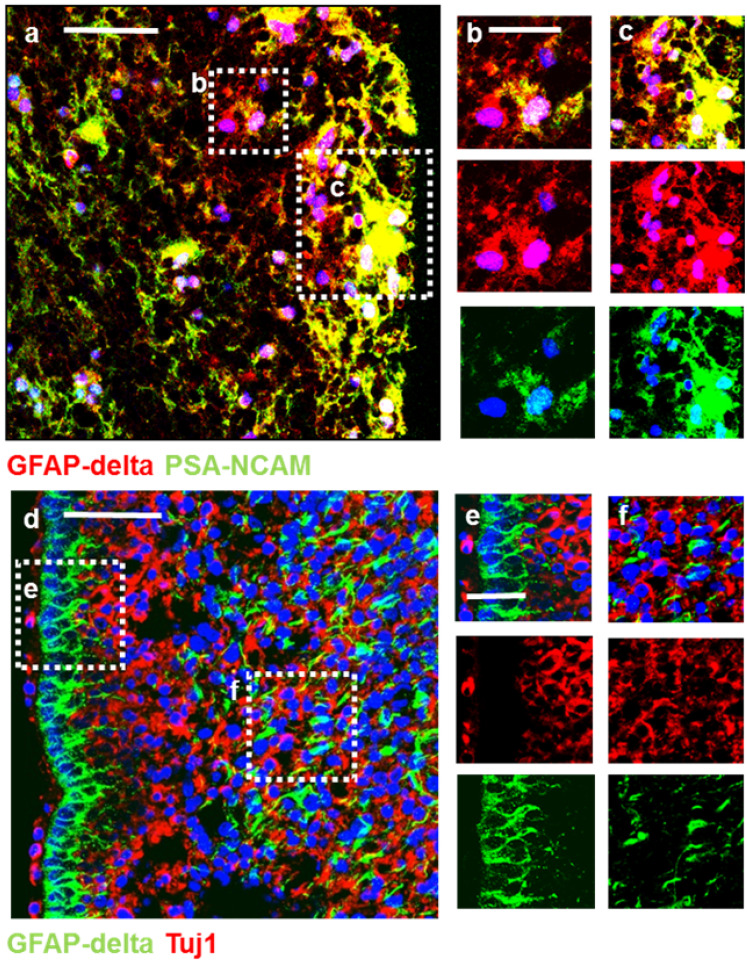
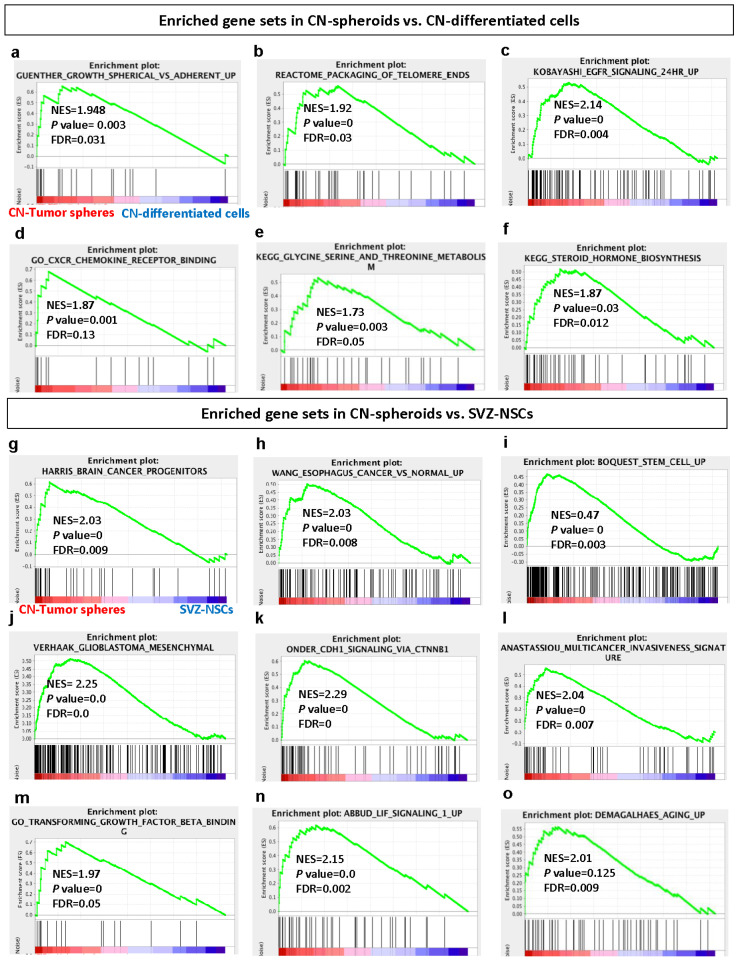
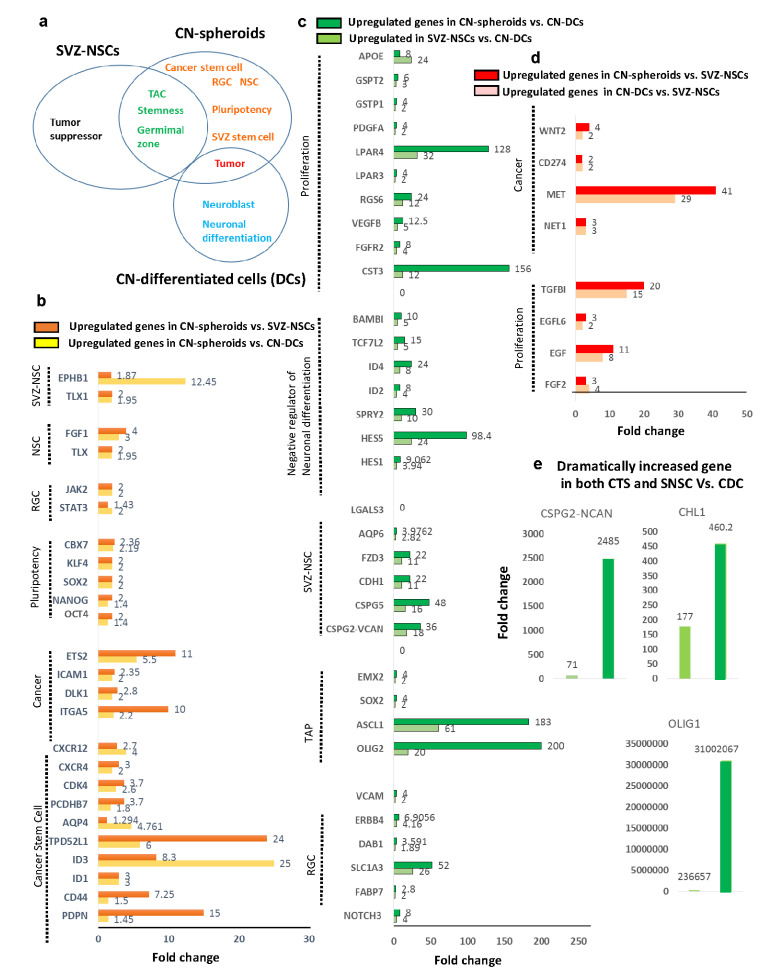
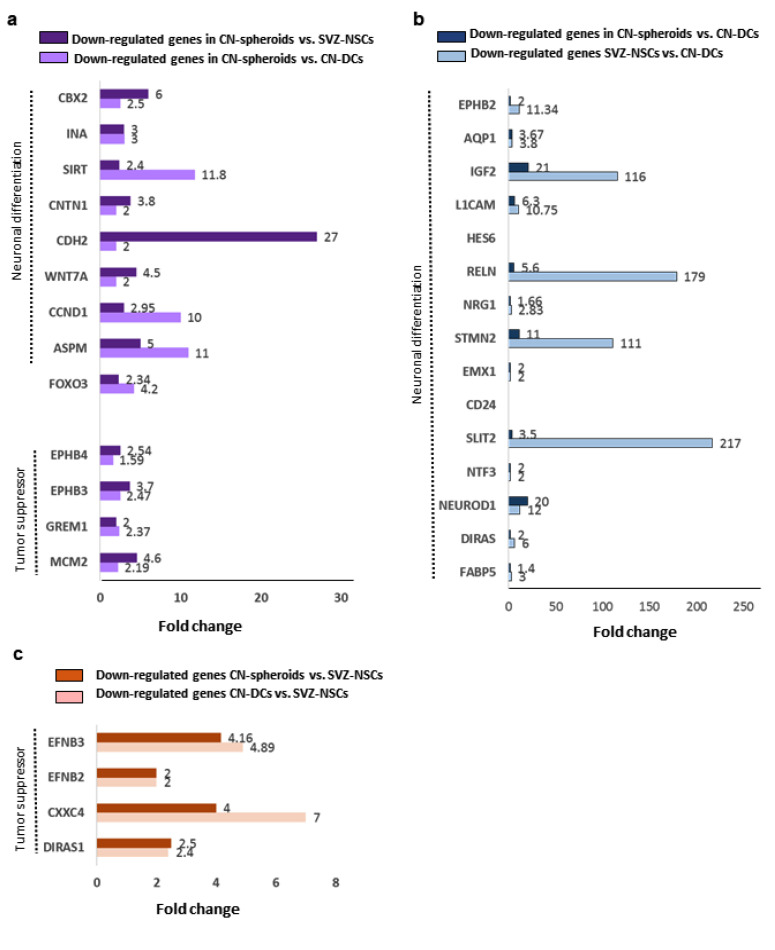
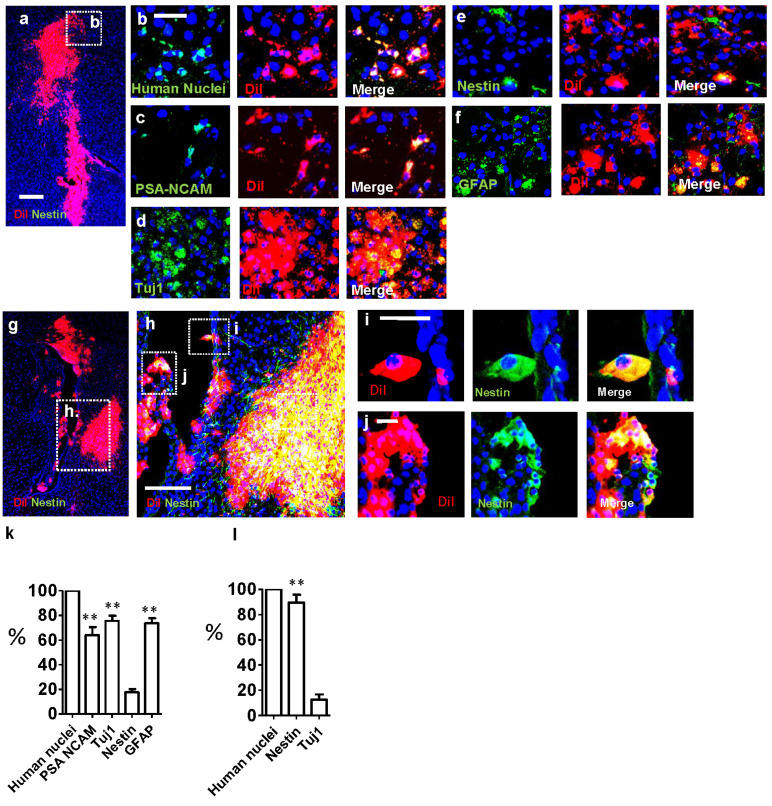
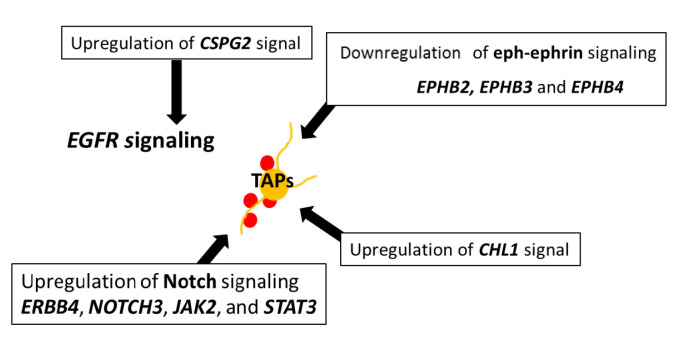
Central neurocytoma (CN) has been known as a benign neuronal tumor. In rare cases, CN undergoes malignant transformation to glioblastomas (GBM). Here we examined its cellular origin by characterizing differentiation potential and gene expression of CN-spheroids. First, we demonstrate that both CN tissue and cultured primary cells recapitulate the hierarchal cellular composition of subventricular zone (SVZ), which is comprised of neural stem cells (NSCs), transit amplifying progenitors (TAPs), and neuroblasts. We then derived spheroids from CN which displayed EGFR+/ MASH+ TAP and BLBP+ radial glial cell (RGC) characteristic, and mitotic neurogenesis and gliogenesis by single spheroids were observed with cycling multipotential cells. CN-spheroids expressed increased levels of pluripotency and tumor stem cell genes such as KLF4 and TPD5L1, when compared to their differentiated cells and human NSCs. Importantly, Gene Set Enrichment Analysis showed that gene sets of GBM-Spheroids, EGFR Signaling, and Packaging of Telomere Ends are enriched in CN-spheroids in comparison with their differentiated cells. We speculate that CN tumor stem cells have TAP and RGC characteristics, and upregulation of EGFR signaling as well as downregulation of eph-ephrin signaling have critical roles in tumorigenesis of CN. And their ephemeral nature of TAPs destined to neuroblasts, might reflect benign nature of CN.

Keywords: Central neurocytoma; Gene Set Enrichment Analysis; Neural stem cell; Radial glia cells; Subventricular zone; Transit-amplifying cells; Tumor spheroids.


Figures

Fig. 1
Fig. 1
Neuroblast-like characteristics of CN. (a, b) Representative images of MRI (Left), H&E (Middle), and Synaptophysin or NeuN (Right) of two patients among three patients. A T2 weighted brain MRI shows an inhomogeneous mass lesion in the left lateral ventricle of Patient 1 (a) and both lateral ventricle of Patient 2 (b). Patient 2 has much bigger size of tumor mass when compared to Patient 1. Red dotted line indicates CN tumor mass. H&E of the Patient 1 (a) and 2 (b) shows sheet of monotonous rounded cells with rounded nuclei. Synaptophysin (a) and NeuN (b) is robustly positive in tumor cells of the patients. (c, d) CN tissue with immunofluorescence staining of PSA-NCAM, BMP2, and Tuj1 (c) and NeuN and MAP2 (d). Each first panel indicates co-localization. (e) Immunofluorescence staining of CN-derived cells grown in ITSFn media shows localization of PSA-NCAM, BMP2 and Tuj1 representing neuroblast character. (f) CN-derived cells have round shape without mature neuronal structures. (g) Up: RT-PCR of CN tissue and CN-differentiated cells shows expression of BMP2, BMP4, BMPR1B, NCAM, Tuj1, and GAPDH. Bottom: Densitometry measurement of each genes relative to GAPDH in tissue and cell. F: 10.77, DFn: 4, p<0.001; Row factor has significant effects. (h) A few cells in CN tissue are Nestin+/BLBP+ representing RGC. (i) CN tissue has a mixed population of BLBP+ cells, BLBP+/PSA-NCAM+, and PSA-NCAM+ cells. (j) Left: RT-PCR of CN tissue and CN-differentiated cells detected expression of BLBP, Nestin, GFAP, and GAPDH. Right: Densitometry measurement of each genes relative to GAPDH. F:2.06, DFn:1 p=0.1461 no effect. Original full-length images of g and j are presented in Supplementary Fig. 3S. Scale bar 6 cm (a), 50 µm (c) 20 µm (e) 100 µm (h, i) 20 µm. All data presented as mean +/- S.D. Two way ANOVA followed by Bonferroni correction and t-test analysis was done. A p value of <0.01 (**), 0.001 (***), and ns: not significant was used to denote statistical significance. Three biological samples (N=3) were used for the experiments.
Fig. 2
Fig. 2
SVZ-neurogenic cellular composition of CN-derived cells and CN tissue. (a) Immunofluorescence staining of CN-differentiated cells at 1 week, showing localization of GFAP-delta+ (Green), and Tuj1+ cells (Red), and GFAP-delta+/Tuj1+(Green/Red) at one week after culture. (b) Immunofluorescence staining of neurogenic RGC cells (GFAP-delta+) showing morphology and arrangement indicative of newly divided cells. (c~f) Immunofluorescence staining of GFAP-delta+/Tuj1+ cells and Tuj1+ cells, showing asymmetrical divisions. (g~i) Tuj1+ cells localized and migrated along the fiber of GFAP-delta+/Tuj1+ (g, h) and GFAP-delta+ cells (i). (j) Example of Tuj1+ neuroblasts, which comprise the major population of CN. (k) Ki67 indicates mitotic and twin-like GFAP-delta+ cells. (l) The basal processes of GFAP-delta+/Tuj1+ cells were wrapped around Tuj1+ neuroblasts at 3 weeks after culture. (m) Immunofluorescence staining of CN tissue, showing localization of GFAP-delta+, GFAP-delta+/Tuj1+, and Tuj1+ labeled cells. (n) GFAP-delta+ cells from CN tissue, showing long processes similar to RGC. (o) TAP-like GFAP-delta+/Tuj1+ cells showing several processes proximal to Tuj1+cells. (p) Immunofluorescence staining of CN tissue showing clustered GFAP-delta+/Tuj1+ cells resembling daughter neuroblasts (Tuj1+). (q) Characteristics of three kinds of cells including GFAP-delta+ Type B, GFAP-delta+/Tuj1+ Type C, and Tuj1+ Type A cells. (r) Percentage of each type of cells (GFAP-delta+ NSC, GFAP-delta+/Tuj1+ TAP, Tuj1+ Neuroblast) in the population of CN: Type B (9.167±1.878 N=3), Type C (22.67±2.333 N=3), and Type A cells (67.47±2.784 N=3). (s) Representative FISH images carried out on these two tumors. Left: FISH images of 1p36 (red signal) as a target and of 1q24 (green signal) as a reference probe. Right: 19q13.3 (red signal) as a target and of 19p13 (green signal) as a reference. Two red and two green signals are evident, which implies no deletion of chromosome 1p and 19q. Scale bars, 50 µm (a) 100 µm (m) 10 µm (s). Three biological samples (N=3) were used for the experiments.
Fig. 3
Fig. 3
Adult human ependymal and fetal SVZ tissue and has the same cell composition of CN. (a) Neurogenic radial glia-like cells (GFAP-delta+) and daughter neuroblasts (PSA-NCAM+) have small population, whereas intermediate progenitor-like cells (GFAP-delta+/PSA-NCAM+) have large portion in normal subependymal tissue. (b) Neurogenic RGC-like GFAP-delta+ cell divided asymmetrically to self-renew and to produce GFAP-delta+/PSA-NCAM+ cell in normal subependymal tissue. (c) TAP-like GFAP-delta+/PSA-NCAM+ cells have large portion in subependymal tissue. (d) Representative image for GFAP-delta and Tuj1 on human fetal SVZ tissue. (e, f) There is no GFAP-delta+/Tuj1+ cells GFAP-delta+ cells near SVZ on human fetal SVZ tissue. Scale bar, 100 µm (a, d) 50 µm (b, e). One enpendymal tissue (N=1) and fetal SVZ (N=1) were used for the experiments.
Fig. 4
Fig. 4
TAP and RGC-like characteristics and bipotentiality of CN-spheroids. (a) Tumor spheroids formed in ITSFn and DMEM-FBS media. (b) Up: Representative images of RT-PCR shows expression of NSC makers: GFAP, Nestin, BLBP, CD133, SOX2, hTERT. In particular, ITSFn-derived CN-spheroids express higher level Nestin, BLBP, CD133, and SOX2. Bottom: Densitometry measurement of each genes relative to GAPDH. (c~h) Immunofluorescence staining of CN-spheroids. Nestin+/BLBP+(c), PSA-NCAM+/BLBP+(d), Nestin+/GFAP-delta+(e). GFAP-delta+/Tuj1+ shows mixed population of RGC and neuroblasts (f). TAP characteristics were confirmed by EGFR+/MASH+ cells (g), SOX2+ cells (h). (i, m) CN-spheroids were attached on the dish and cultured up to 4 weeks. Phase contrast view of ITSFn- (i) and DMEM-FBS-(m) cultured CN tumor sphere shows migration and differentiation of cells at the edge of the sphere. (j~l) CN-spheroids cultured in ITSFn differentiated mostly into neuronal cells (j). (n~p) DMEM-FBS media induced more glia differentiation of the CN-spheroids (n). (q, r) Ca2+ imaging (lower left panels) and immunofluorescence staining (lower right panels) of CN-spheroids cultured in ITSFn (left) and DMEM-FBS (right) media. Cells were pre-loaded with Fura 2. AM, washed and pre-incubated for at least 10 min prior to the addition of KCl (133 mM) for 60 sec. (s) The time of KCl addition is indicated by red. The level of Ca2+ responses to high K+ was almost two folds in CN-spheroids in ITSFn as compared to DMEM-FBS. Error bars indicate SEM. (t) Up: Representative images of RT-PCR shows expression of NSC makers: GFAP, Nestin, BLBP, CD133, SOX2, hTERT. Bottom: Densitometry measurement of each genes relative to GAPDH. Original full-length images of b and t are presented in Supplementary Fig. 3S. Scale bars, 100 µm (c, g, j). All data presented as mean +/- S.D. Two way ANOVA followed by Bonferroni correction and t-test analysis was done. A p value of <0.05 (*) or 0.01 (**), 0.001(***), and ns: not significant was used to denote statistical significance. Three biological samples (N=3) were used for the experiments.
Fig. 5
Fig. 5
Long-term culture of CN-differentiated cells show bipotential in response to different environmental niche. (a~c) Most of the cells matured into astrocytes in DMEM-FBS. No neuronal activity was observed in those astrocytes. (d~f) Fully matured neuronal cells (MAP2+; Red /NeuN+; Green) were observed in ITSFn media, and those neuronal cells showed high level of Ca2+ transient in response to high KCl. (g) Ca2+ response of cells in ITSFn media by 30 mM K+ in the absence or presence of 2 M nimodipine. (h) Whole cell recordings of CN-differentiated cells under voltage clamp held at -70 mV. Voltage steps of 10 mV were applied to the cell under voltage clamp. Each trace indicated a recording of different cells. (i) CN-derived neuroblasts matured into neuron for 4 weeks analyzed by current injection of 20 pA steps under current clamp. Action potentials were blocked by 0.5 uM TTX. Out of 14 cells, 3 cells showed action potentials. After TTX was washed off, action potentials were revived. (j) The biocytin solution was filled into the electrodes, and injected to the cells which show action potectial for morphological analysis, and these cells these cells were confirmed as MAP2+ by immunostaining. Scale bars, 50 µm (b, e, j).
Fig. 6
Fig. 6
GSEA algorithm shows that gene sets of tumor spheroid and NSCs are highly enriched in CN-spheroids in comparison with CN-differentiated cells and SVZ-NSC. In every thumbnail, the green curve represents the evolution of the density of the genes identified in microarray gene chip. The heatmap on the right shows where the gene expression is relatively high (red) or low (blue) for each gene in the indicated sample. (a~f) Enriched gene sets in CN-spheroids versus CN-differentiated cells. (a) GUENTHER_GROWTH_SPHERICAL_VS_ADHERENT_UP. (b) REACTOME_PACKAGING_OF_TELOMERE_ENDS. (c) KOBAYASHI_EGFR_SIGNALING_24HR_UP. (d) GO_CXCR_CHEMOKINE_RECEPTOR_BINDING. (e) KEGG_GLYCINE_SERINE_AND_THREONINE_METABOLISM. (f) KEGG_STEOROID_HORMONE_BIOSYNTHESIS. (g~o) Enriched gene sets in CN-spheroids vs. SVZ-NSCs. (g) HARRIS_BRAIN_CANCER_PROGENITORS: Genes from the brain cancer stem (cancer stem cell, CSC) signature. (h)WANG_ESOPHAGUS_CANCER_VS_NORMAL_UP: Up-regulated genes specific to esophageal adenocarcinoma (EAC) relative to normal tissue. (i) BOQUEST_STEM_CELL_UP: Genes up-regulated in freshly isolated CD31- (stromal stem cells from adipose tissue) versus the CD31+ (non-stem) counterparts. (j) VERHAAK_GLIOBLASTOMA_MESENCHYMAL: Genes correlated with mesenchymal type of glioblastoma multiforme tumors. (k) ONDER_CDH1_SIGNALING_VIA_CTNNB1. (l) ANASTASSIOU_MULTICANCER_INVASIVENESS_SIGNATURE: Invasiveness signature resulting from cancer cell/microenvironment interaction. (m) GO_TRANSFORMING_GROWTH_FACTOR_BETA_BINDING (Gene Ontology (GO): Interacting selectively and non-covalently with TGF-beta, transforming growth factor beta, a multifunctional peptide that controls proliferation, differentiation and other functions in many cell types. (n) ABBUD_LIF_SIGNALING_1_UP: Genes up-regulated in AtT20 cells (pituitary cancer) after treatment with LIF. (o) DEMAGALHAES_AGING_UP: Genes consistently overexpressed with age, based on meta-analysis of microarray data.
Fig. 7
Fig. 7
Analysis of differential gene expression shows TAP- and RGC-like characteristics of CN spheroids from aggressive form of CN and their upregulation of cancer stem cell genes. (a) Schematic showing overlap of genes in each category that are upregulated in SVZ-NSCs, CN-spheroids, and CN-differentiated cells. (b) Genes that are upregulated in CN-spheroids as compared to both SVZ-NSCs and CN- differentiated cells. Orange: Upregulated genes in CN-Spheroids vs SVZ-NSCs. Yellow: Upregulated genes in CN-Spheroids vs CN-differentiated cells. (c) Genes that are upregulated in CN-spheroids or SVZ-NSCs in comparison with CN-differentiated cells. Green: Upregulated genes in CN-Spheroids vs CN-differentiated cells. Light green: Upregulated genes in SVZ-NSCs vs CN-differentiated cells. (d) Genes that are upregulated in CN-spheroids or CN-differentiated cells in comparison with SVZ-NSCs. Orange: Upregulated genes in CN-Spheroids vs SVZ-NSCs. Peach: Upregulated genes in CN-differentiated cells vs SVZ-NSCs. (e) Dramatically upregulated genes in both CN-Spheroids and SVZ-NSCs vs CN-differentiated cells. One sample of CN-spheroids (N=1), CN-differentiated cells (N=1), and SVZ-NSCs (N=1) respectively analyzed.
Fig. 8
Fig. 8
Analysis of downregulated genes in CN-spheroids in comparison with CN-differentiated cells (DCs) and SVZ-NSCs to detect genes associated with tumorigenesis and neurogenesis. (a) Genes that are downregulated in CN-spheroids as compared both SVZ-NSCs and CN-DCs. Purple: Downregulated genes in CN-spheroids vs SVZ-NSCs. Light purple: Downregulated genes in CN-Spheroids vs CN- DCs. (b) Genes that are upregulated in CN-spheroids or SVZ-NSCs in comparison with CN-DCs. Blue: Downregulated genes in CN-spheroids vs CN-DCs. Light blue: Downregulated genes in SVZ-NSCs vs CN-DCs. (c) Genes that are downregulated in CN-spheroids or CN-DCs in comparison with SVZ-NSCs. Orange: Downregulated genes in CN-spheroids vs SVZ-NSCs. Light Orange: Upregulated genes in CN-DCs vs SVZ-NSCs. One sample of CN-tumor spheres (N=1), CN-DCs (N=1), and SVZ-NSCs (N=1) were respectively analyzed.
Fig. 9
Fig. 9
Immunofluorescence analysis of CN cells engrafted into striatum of immune-deficient NOD-SCID mice. (a) Low power image of the grafted area showing DiI-labeled CN cells four weeks after engraftment. (b) Expression of hNA+ in DiI+ cells, confirming that Dil+ cells are from the CN-derived cells, not a result of contamination from the dye. (c~f) Immunofluorescence staining of CN-derived cells engrafted in the striatum near the SVZ, showing Tuj1+, PSA-NCAM+, GFAP+, and PSA-NCAM+ cells have morphology of migrating neuroblasts. (g) DiI-labeled fetal brain-derived SNSCs four weeks after engraftment in low power image. (h~i) Immunofluorescence staining of fetal brain-derived SNSCs grafted in the striatum near the SVZ shows that a majority of the cells are Nestin+. (h, l) Cellular composition of the CN-derived cells (h) and fetal brain-derived SNSCs (l), four weeks after engraftment in the striatum near the SVZ, respectively. Most of the DiI+ CN cells were PSA-NCAM+ or Tuj1+, whereas fewer cells were hNestin+ (h). Meanwhile, most of the fetal brain-derived SNSCs grafted in the striatum near SVZ were Nestin+, and very few cells were Tuj1+ (l). One-Way ANOVA analysis, ** (p<0.05) compared to Nestin (h) and Tuj1 (l). Scale bar, 50 µm (b~f) 100 µm (h) 25 µm (i, j). Three animals (N=3) were analyzed.
Fig. 10
Fig. 10
Schematic summary of the key gene sets which presumably cause tumorigenesis of CN spheroids. CN-spheroids show upregulation of EGFR signaling, CSPG signaling, and Notch signaling, whereas eph-ephrin signaling is downregulated. CSPGs stimulate NSC survival through enhanced EGFR signaling. ERBB4 of Notch signaling is also function as oncogene. Eph-ephrin signaling, which is comprised with EPHB2, EPHB3 and EPHB4, are known as putative tumor suppressor genes. CHL1 is expressed and functions as a malignancy promoter in GBM cells.

Similar articles

Cited by

References

    1. Smith AB, Smirniotopoulos JG, Horkanyne-Szakaly I. From the radiologic pathology archives: intraventricular neoplasms: radiologic-pathologic correlation. Radiographics. 2013;33:21–43. doi: 10.1148/rg.331125192. - DOI - PubMed
    1. Chen CL, Shen CC, Wang J, Lu CH, Lee HT. Central neurocytoma: a clinical, radiological and pathological study of nine cases. Clin Neurol Neurosurg. 2008;110:129–136. doi: 10.1016/j.clineuro.2007.09.023. - DOI - PMC - PubMed
    1. Muragaki Y, Chernov M, Tajika Y, Kubo O, Iseki H, Hori T, Takakura K. Coincidence of central neurocytoma and multiple glioblastomas: a rare case report. J Neurooncol. 2009;93:431–435. doi: 10.1007/s11060-008-9793-0. - DOI - PubMed
    1. Junttila MR, de Sauvage FJ. Influence of tumour micro-environment heterogeneity on therapeutic response. Nature. 2013;501:346–354. doi: 10.1038/nature12626. - DOI - PubMed
    1. Sim FJ, Keyoung HM, Goldman JE, Kim DK, Jung HW, Roy NS, Goldman SA. Neurocytoma is a tumor of adult neuronal progenitor cells. J Neurosci. 2006;26:12544–12555. doi: 10.1523/JNEUROSCI.0829-06.2006. - DOI - PMC - PubMed