Air quality-related health damages of food
- PMID: 33972419
- PMCID: PMC8158015
- DOI: 10.1073/pnas.2013637118
Air quality-related health damages of food
Abstract
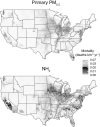
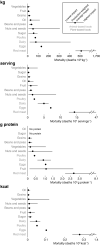
Agriculture is a major contributor to air pollution, the largest environmental risk factor for mortality in the United States and worldwide. It is largely unknown, however, how individual foods or entire diets affect human health via poor air quality. We show how food production negatively impacts human health by increasing atmospheric fine particulate matter (PM2.5), and we identify ways to reduce these negative impacts of agriculture. We quantify the air quality-related health damages attributable to 95 agricultural commodities and 67 final food products, which encompass >99% of agricultural production in the United States. Agricultural production in the United States results in 17,900 annual air quality-related deaths, 15,900 of which are from food production. Of those, 80% are attributable to animal-based foods, both directly from animal production and indirectly from growing animal feed. On-farm interventions can reduce PM2.5-related mortality by 50%, including improved livestock waste management and fertilizer application practices that reduce emissions of ammonia, a secondary PM2.5 precursor, and improved crop and animal production practices that reduce primary PM2.5 emissions from tillage, field burning, livestock dust, and machinery. Dietary shifts toward more plant-based foods that maintain protein intake and other nutritional needs could reduce agricultural air quality-related mortality by 68 to 83%. In sum, improved livestock and fertilization practices, and dietary shifts could greatly decrease the health impacts of agriculture caused by its contribution to reduced air quality.
Keywords: agriculture; air quality; fine particulate matter; food; pollution.
Copyright © 2021 the Author(s). Published by PNAS.
Conflict of interest statement
The authors declare no competing interest.
Figures


Comment in
-
Disproportionate contributions to air quality-related deaths: The latest case against red meat.Proc Natl Acad Sci U S A. 2021 Jun 1;118(22):e2107118118. doi: 10.1073/pnas.2107118118. Proc Natl Acad Sci U S A. 2021. PMID: 34001666 Free PMC article. No abstract available.
Similar articles
-
Hidden cost of U.S. agricultural exports: particulate matter from ammonia emissions.Environ Sci Technol. 2014 Jan 21;48(2):903-8. doi: 10.1021/es4034793. Epub 2014 Jan 8. Environ Sci Technol. 2014. PMID: 24370064
-
Ammonia emissions from agriculture and their contribution to fine particulate matter: A review of implications for human health.J Environ Manage. 2022 Dec 1;323:116285. doi: 10.1016/j.jenvman.2022.116285. Epub 2022 Sep 21. J Environ Manage. 2022. PMID: 36261990 Review.
-
Fine particulate matter damages and value added in the US economy.Proc Natl Acad Sci U S A. 2019 Oct 1;116(40):19857-19862. doi: 10.1073/pnas.1905030116. Epub 2019 Sep 9. Proc Natl Acad Sci U S A. 2019. PMID: 31501345 Free PMC article.
-
Air-quality-related health impacts from climate change and from adaptation of cooling demand for buildings in the eastern United States: An interdisciplinary modeling study.PLoS Med. 2018 Jul 3;15(7):e1002599. doi: 10.1371/journal.pmed.1002599. eCollection 2018 Jul. PLoS Med. 2018. PMID: 29969461 Free PMC article.
-
Airborne reduced nitrogen: ammonia emissions from agriculture and other sources.Environ Int. 2003 Jun;29(2-3):277-86. doi: 10.1016/S0160-4120(02)00186-1. Environ Int. 2003. PMID: 12676214 Review.
Cited by
-
Adipose Tissue Dysfunction Related to Climate Change and Air Pollution: Understanding the Metabolic Consequences.Int J Mol Sci. 2024 Jul 18;25(14):7849. doi: 10.3390/ijms25147849. Int J Mol Sci. 2024. PMID: 39063092 Free PMC article. Review.
-
Zinc Protects against Swine Barn Dust-Induced Cilia Slowing.Biomolecules. 2024 Jul 12;14(7):843. doi: 10.3390/biom14070843. Biomolecules. 2024. PMID: 39062557 Free PMC article.
-
Plant-based diets, animal agriculture, and the connection with urological and planetary health.Curr Opin Urol. 2024 Sep 1;34(5):352-357. doi: 10.1097/MOU.0000000000001191. Epub 2024 May 31. Curr Opin Urol. 2024. PMID: 38832408 Review.
-
On the Role of Starchy Grains in Ice Nucleation Processes.ACS Food Sci Technol. 2024 Apr 11;4(5):1039-1051. doi: 10.1021/acsfoodscitech.3c00561. eCollection 2024 May 17. ACS Food Sci Technol. 2024. PMID: 38779384 Free PMC article.
-
Impacts assessment of nitrification inhibitors on U.S. agricultural emissions of reactive nitrogen gases.J Environ Manage. 2024 May;359:121043. doi: 10.1016/j.jenvman.2024.121043. Epub 2024 May 8. J Environ Manage. 2024. PMID: 38723497
References
-
- Poore J., Nemecek T., Reducing food’s environmental impacts through producers and consumers. Science 360, 987–992 (2018). - PubMed
-
- Willett W., et al. ., Food in the Anthropocene: The EAT-Lancet Commission on healthy diets from sustainable food systems. Lancet 393, 447–492 (2019). - PubMed
-
- Clark M., Hill J., Tilman D., The diet, health, and environmental trilemma. Annu. Rev. Environ. Resour. 43, 109–134 (2018).
-
- Godfray H. C. J., et al. ., Meat consumption, health, and the environment. Science 361, 6399 (2018). - PubMed
Publication types
MeSH terms
Substances
Grants and funding
LinkOut - more resources
Full Text Sources
Other Literature Sources
Medical

