

NEM-Tar: A Probabilistic Graphical Model for Cancer Regulatory Network Inference and Prioritization of Potential Therapeutic Targets From Multi-Omics Data
- PMID: 33968127
- PMCID: PMC8100334
- DOI: 10.3389/fgene.2021.608042
NEM-Tar: A Probabilistic Graphical Model for Cancer Regulatory Network Inference and Prioritization of Potential Therapeutic Targets From Multi-Omics Data
Abstract
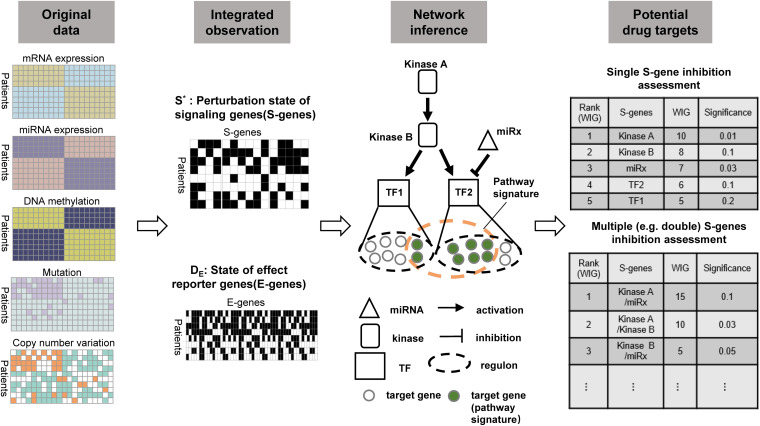
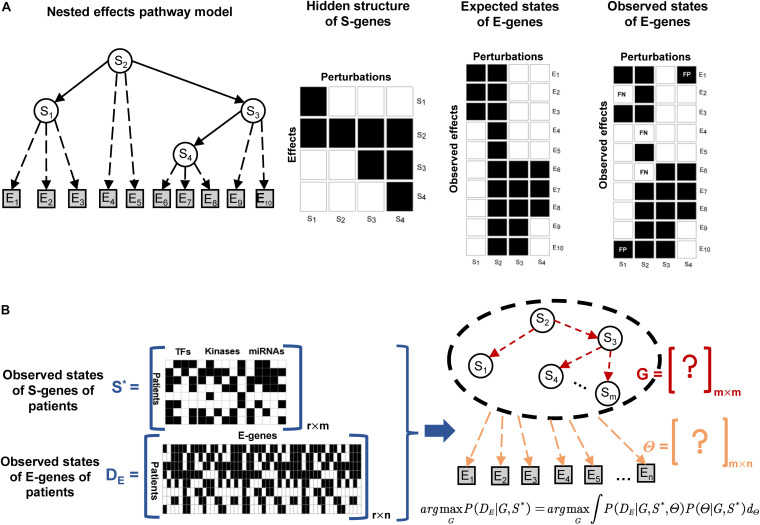
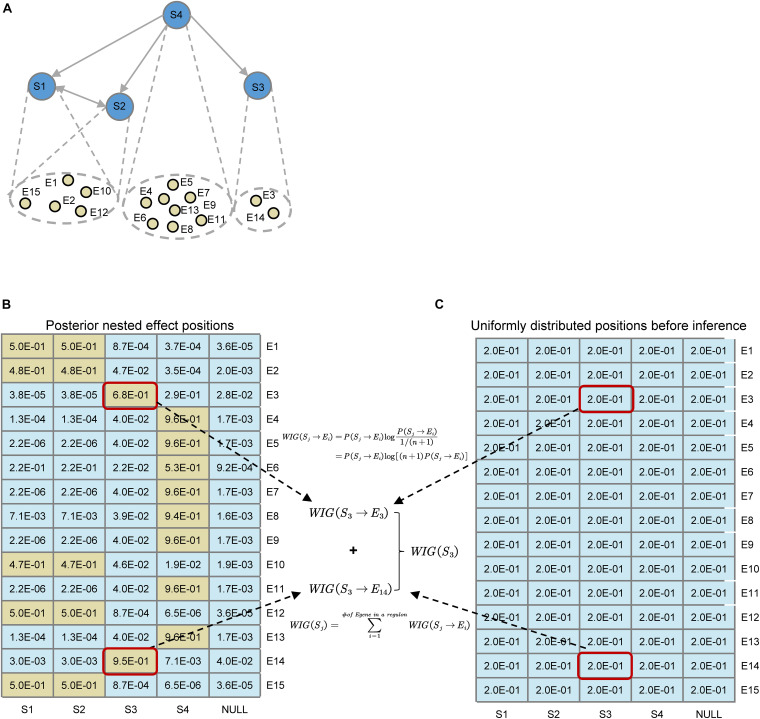
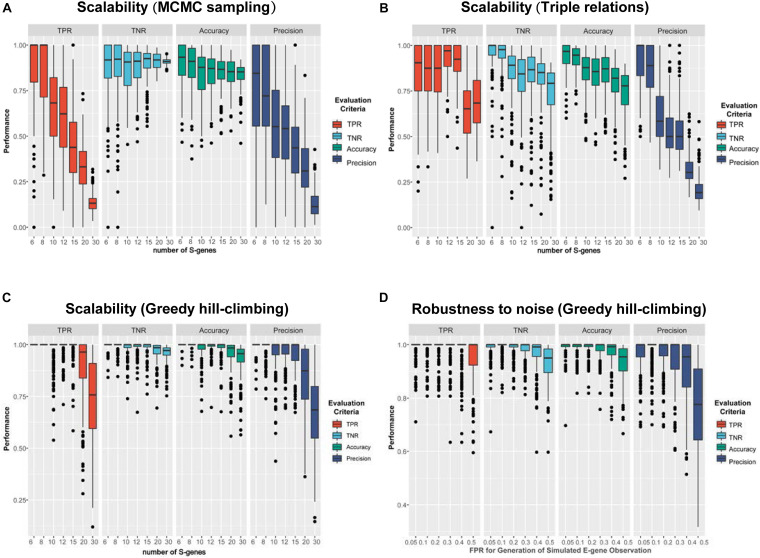
Targeted therapy has been widely adopted as an effective treatment strategy to battle against cancer. However, cancers are not single disease entities, but comprising multiple molecularly distinct subtypes, and the heterogeneity nature prevents precise selection of patients for optimized therapy. Dissecting cancer subtype-specific signaling pathways is crucial to pinpointing dysregulated genes for the prioritization of novel therapeutic targets. Nested effects models (NEMs) are a group of graphical models that encode subset relations between observed downstream effects under perturbations to upstream signaling genes, providing a prototype for mapping the inner workings of the cell. In this study, we developed NEM-Tar, which extends the original NEMs to predict drug targets by incorporating causal information of (epi)genetic aberrations for signaling pathway inference. An information theory-based score, weighted information gain (WIG), was proposed to assess the impact of signaling genes on a specific downstream biological process of interest. Subsequently, we conducted simulation studies to compare three inference methods and found that the greedy hill-climbing algorithm demonstrated the highest accuracy and robustness to noise. Furthermore, two case studies were conducted using multi-omics data for colorectal cancer (CRC) and gastric cancer (GC) in the TCGA database. Using NEM-Tar, we inferred signaling networks driving the poor-prognosis subtypes of CRC and GC, respectively. Our model prioritized not only potential individual drug targets such as HER2, for which FDA-approved inhibitors are available but also the combinations of multiple targets potentially useful for the design of combination therapies.
Keywords: cancer; combination therapy; drug targets; molecular subtype; nested effects model; regulatory network.
Copyright © 2021 Zhang, Zhu and Wang.
Conflict of interest statement
The authors declare that the research was conducted in the absence of any commercial or financial relationships that could be construed as a potential conflict of interest.
Figures
Similar articles
-
NEMix: single-cell nested effects models for probabilistic pathway stimulation.PLoS Comput Biol. 2015 Apr 16;11(4):e1004078. doi: 10.1371/journal.pcbi.1004078. eCollection 2015 Apr. PLoS Comput Biol. 2015. PMID: 25879530 Free PMC article.
-
SCNrank: spectral clustering for network-based ranking to reveal potential drug targets and its application in pancreatic ductal adenocarcinoma.BMC Med Genomics. 2020 Apr 3;13(Suppl 5):50. doi: 10.1186/s12920-020-0681-6. BMC Med Genomics. 2020. PMID: 32241274 Free PMC article.
-
Diffusion mapping of drug targets on disease signaling network elements reveals drug combination strategies.Pac Symp Biocomput. 2018;23:92-103. Pac Symp Biocomput. 2018. PMID: 29218872
-
Drug-disease association and drug-repositioning predictions in complex diseases using causal inference-probabilistic matrix factorization.J Chem Inf Model. 2014 Sep 22;54(9):2562-9. doi: 10.1021/ci500340n. Epub 2014 Aug 22. J Chem Inf Model. 2014. PMID: 25116798
-
Biological Network Inference and analysis using SEBINI and CABIN.Methods Mol Biol. 2009;541:551-76. doi: 10.1007/978-1-59745-243-4_24. Methods Mol Biol. 2009. PMID: 19381531 Review.
References
-
- Andrieu C., de Freitas N., Doucet A., Jordan M. I. (2003). An Introduction to MCMC for Machine Learning. Mach. Learn. 50 5–43. 10.1023/a:1020281327116 - DOI
-
- Bang Y.-J., Van Cutsem E., Feyereislova A., Chung H. C., Shen L., Sawaki A., et al. (2010). Trastuzumab in combination with chemotherapy versus chemotherapy alone for treatment of HER2-positive advanced gastric or gastro-oesophageal junction cancer (ToGA): a phase 3, open-label, randomised controlled trial. Lancet 376 687–697. 10.1016/S0140-6736(10)61121-X - DOI - PubMed
LinkOut - more resources
Full Text Sources
Research Materials
Miscellaneous