

GEO Data Mining Identifies OLR1 as a Potential Biomarker in NSCLC Immunotherapy
- PMID: 33959497
- PMCID: PMC8095246
- DOI: 10.3389/fonc.2021.629333
GEO Data Mining Identifies OLR1 as a Potential Biomarker in NSCLC Immunotherapy
Abstract
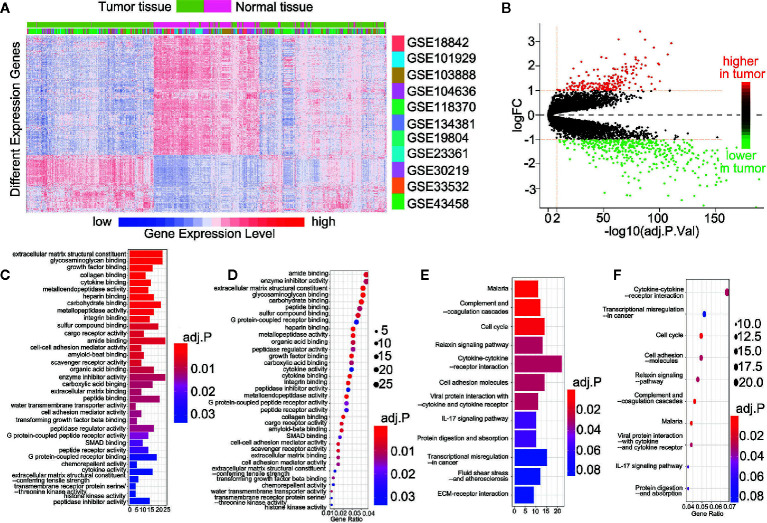
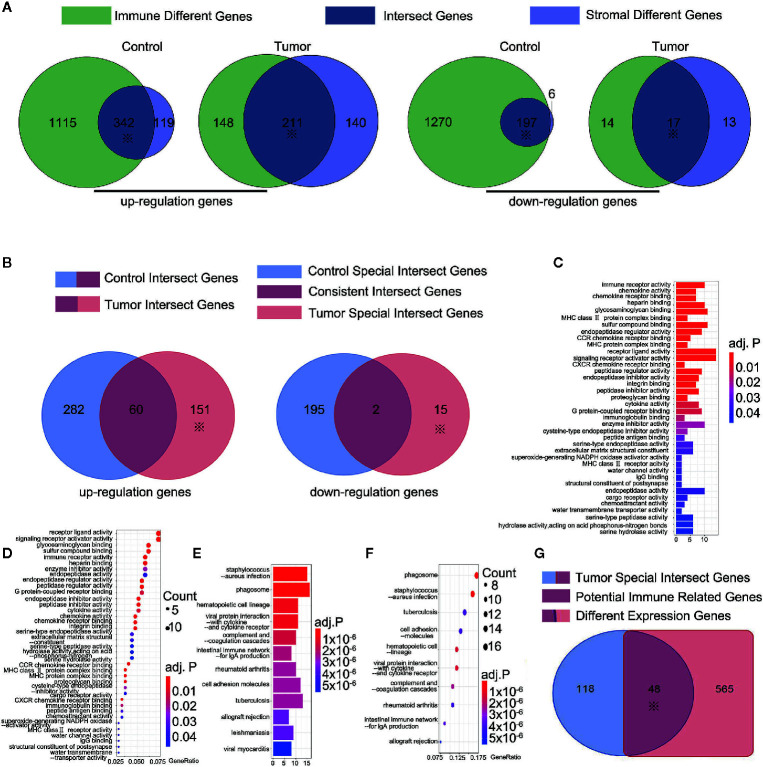
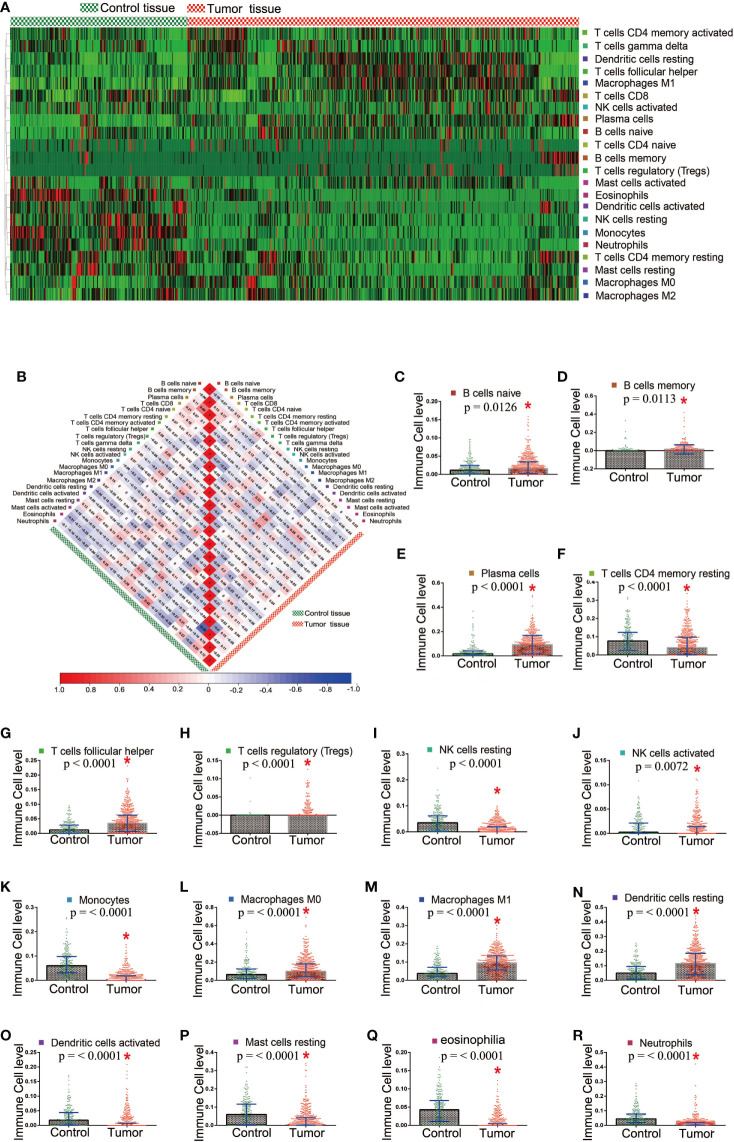
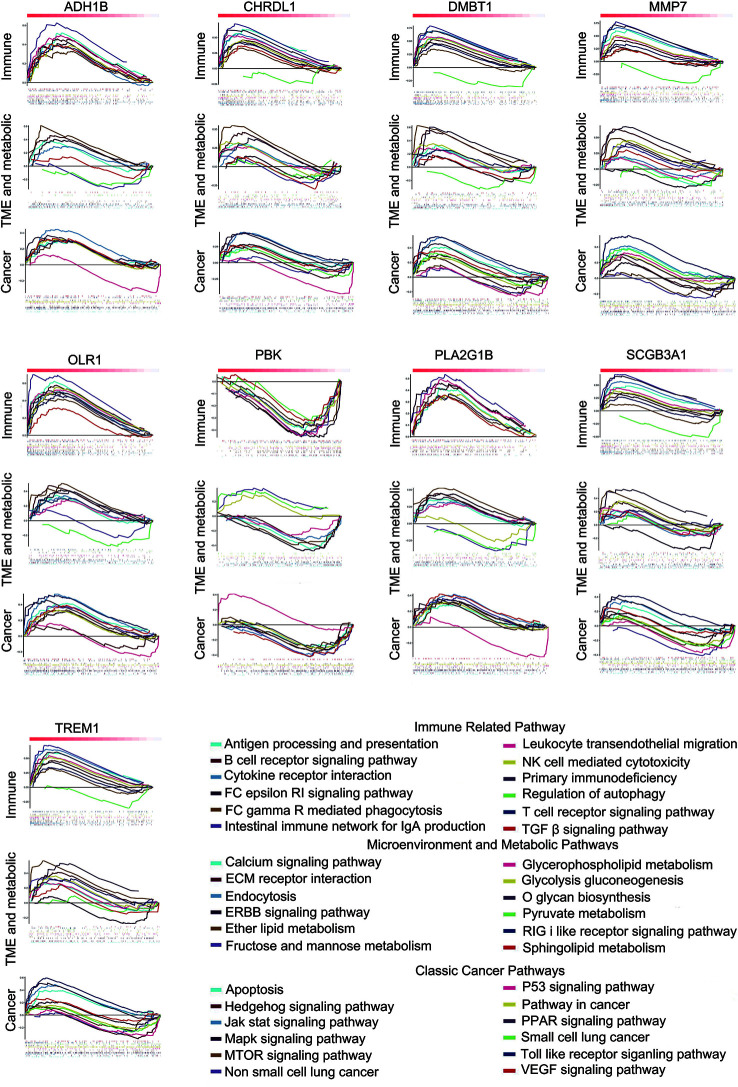
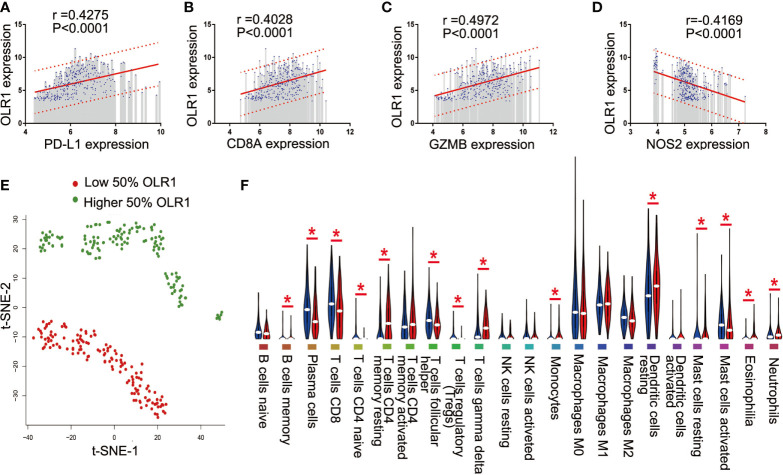
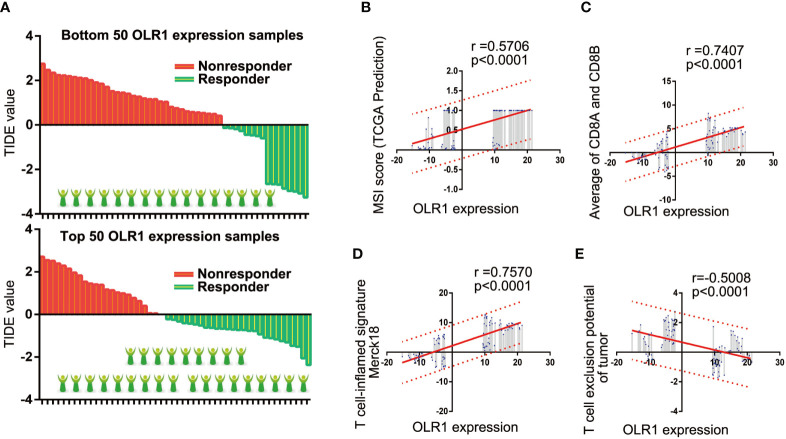
Non-small cell lung cancer (NSCLC) is the most common type of lung cancer. The tumor immune microenvironment (TME) in NSCLC is closely correlated to tumor initiation, progression, and prognosis. TME failure impedes the generation of an effective antitumor immune response. In this study, we attempted to explore TME and identify a potential biomarker for NSCLC immunotherapy. 48 potential immune-related genes were identified from 11 eligible Gene Expression Omnibus (GEO) data sets. We applied the CIBERSORT computational approach to quantify bulk gene expression profiles and thereby infer the proportions of 22 subsets of tumor-infiltrating immune cells (TICs); 16 kinds of TICs showed differential distributions between the tumor and control tissue samples. Multiple linear regression analysis was used to determine the correlation between TICs and 48 potential immune-related genes. Nine differential immune-related genes showed statistical significance. We analyzed the influence of nine differential immune-related genes on NSCLC immunotherapy, and OLR1 exhibited the strongest correlation with four well-recognized biomarkers (PD-L1, CD8A, GZMB, and NOS2) of immunotherapy. Differential expression of OLR1 showed its considerable potential to divide TICs distribution, as determined by non-linear dimensionality reduction analysis. In immunotherapy prediction analysis with the comparatively reliable tool TIDE, patients with higher OLR1 expression were predicted to have better immunotherapy outcomes, and OLR1 expression was potentially highly correlated with PD-L1 expression, the average of CD8A and CD8B, IFNG, and Merck18 expression, T cell dysfunction and exclusion potential, and other significant immunotherapy predictors. These findings contribute to the current understanding of TME with immunotherapy. OLR1 also shows potential as a predictor or a regulator in NSCLC immunotherapy.
Keywords: PD-L1; immune checkpoint; immunotherapy; non-small cell lung cancer; tumor microenvironment.
Copyright © 2021 Liu, Wang, Gu, Zhao, Ma and Wang.
Conflict of interest statement
The authors declare that the research was conducted in the absence of any commercial or financial relationships that could be construed as a potential conflict of interest.
Figures
Similar articles
-
Association of Survival and Immune-Related Biomarkers With Immunotherapy in Patients With Non-Small Cell Lung Cancer: A Meta-analysis and Individual Patient-Level Analysis.JAMA Netw Open. 2019 Jul 3;2(7):e196879. doi: 10.1001/jamanetworkopen.2019.6879. JAMA Netw Open. 2019. PMID: 31290993 Free PMC article.
-
Comprehensive Bioinformatics Analysis Identifies Tumor Microenvironment and Immune-related Genes in Small Cell Lung Cancer.Comb Chem High Throughput Screen. 2020;23(5):381-391. doi: 10.2174/1386207323666200407075004. Comb Chem High Throughput Screen. 2020. PMID: 32264809
-
Stromal PD-L1-Positive Regulatory T cells and PD-1-Positive CD8-Positive T cells Define the Response of Different Subsets of Non-Small Cell Lung Cancer to PD-1/PD-L1 Blockade Immunotherapy.J Thorac Oncol. 2018 Apr;13(4):521-532. doi: 10.1016/j.jtho.2017.11.132. Epub 2017 Dec 18. J Thorac Oncol. 2018. PMID: 29269008
-
The Significance of the PD-L1 Expression in Non-Small-Cell Lung Cancer: Trenchant Double Swords as Predictive and Prognostic Markers.Clin Lung Cancer. 2018 Mar;19(2):120-129. doi: 10.1016/j.cllc.2017.10.014. Epub 2017 Oct 28. Clin Lung Cancer. 2018. PMID: 29153898 Review.
-
Immunotherapy in NSCLC patients with brain metastases. Understanding brain tumor microenvironment and dissecting outcomes from immune checkpoint blockade in the clinic.Cancer Treat Rev. 2020 Sep;89:102067. doi: 10.1016/j.ctrv.2020.102067. Epub 2020 Jul 7. Cancer Treat Rev. 2020. PMID: 32682248 Review.
Cited by
-
Prognostic value of plasma microRNAs for non-small cell lung cancer based on data mining models.BMC Cancer. 2024 Jan 10;24(1):52. doi: 10.1186/s12885-024-11830-9. BMC Cancer. 2024. PMID: 38200421 Free PMC article.
-
PRRX1-OLR1 axis supports CAFs-mediated lung cancer progression and immune suppression.Cancer Cell Int. 2024 Jul 15;24(1):247. doi: 10.1186/s12935-024-03436-9. Cancer Cell Int. 2024. PMID: 39010054 Free PMC article.
-
Exploring scavenger receptor class F member 2 and the importance of scavenger receptor family in prediagnostic diseases.Toxicol Res. 2023 Apr 14;39(3):341-353. doi: 10.1007/s43188-023-00176-2. eCollection 2023 Jul. Toxicol Res. 2023. PMID: 37398563 Free PMC article. Review.
-
Identification and verification of the ferroptosis- and pyroptosis-associated prognostic signature for low-grade glioma.Bosn J Basic Med Sci. 2022 Sep 16;22(5):728-750. doi: 10.17305/bjbms.2021.6888. Bosn J Basic Med Sci. 2022. PMID: 35276059 Free PMC article.
-
Fc fragment of IgG binding protein is correlated with immune infiltration levels in hepatocellular carcinoma.Biomol Biomed. 2023 Jul 3;23(4):605-615. doi: 10.17305/bb.2022.8586. Biomol Biomed. 2023. PMID: 36803544 Free PMC article.
References
LinkOut - more resources
Full Text Sources
Other Literature Sources
Research Materials