. 2021 Jun;25(11):5269-5282.
doi: 10.1111/jcmm.16537. Epub 2021 May 6.

Foxo1-induced miR-92b down-regulation promotes blood-brain barrier damage after ischaemic stroke by targeting NOX4

Affiliations

Foxo1-induced miR-92b down-regulation promotes blood-brain barrier damage after ischaemic stroke by targeting NOX4

Jian Shen et al. J Cell Mol Med. 2021 Jun.

Abstract

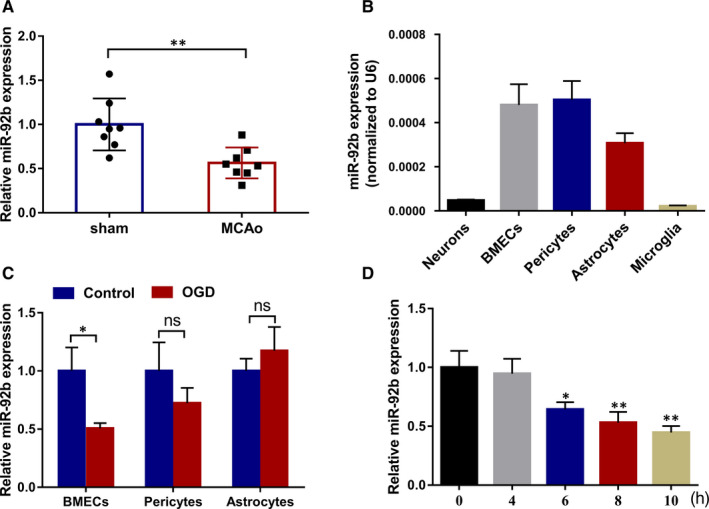
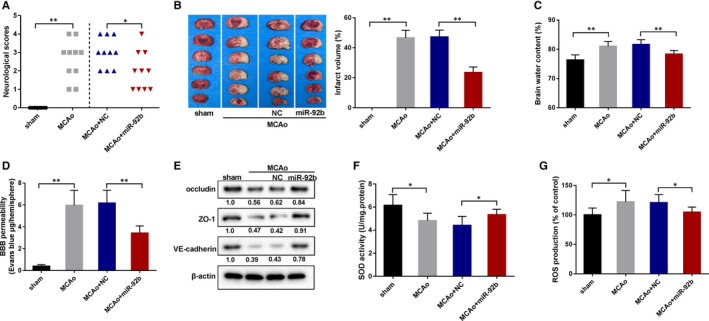
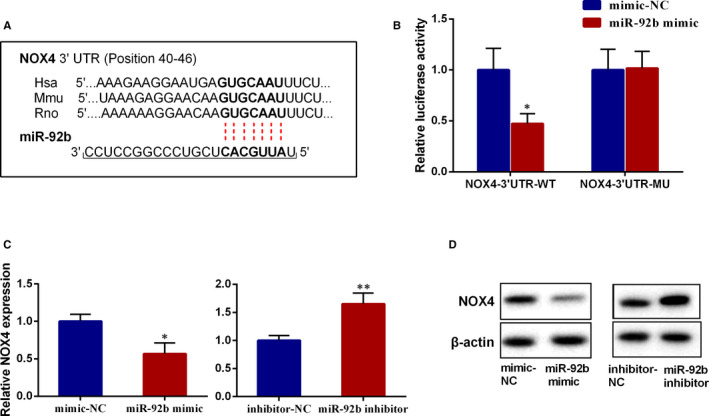
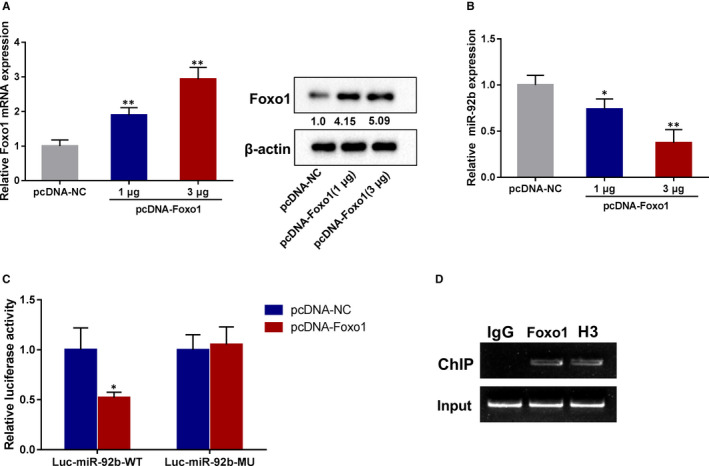
The blood-brain barrier (BBB) damage is a momentous pathological process of ischaemic stroke. NADPH oxidases 4 (NOX4) boosts BBB damage after ischaemic stroke and its expression can be influenced by microRNAs. This study aimed to probe into whether miR-92b influenced the BBB damage after ischaemic stroke by regulating NOX4 expression. Here, miR-92b expression was lessened in the ischaemic brains of rats and oxygen-glucose deprivation (OGD)-induced brain microvascular endothelial cells (BMECs). In middle cerebral artery occlusion (MCAo) rats, miR-92b overexpression relieved the ameliorated neurological function and protected the BBB integrity. In vitro model, miR-92b overexpression raised the viability and lessened the permeability of OGD-induced BMECs. miR-92b targeted NOX4 and regulated the viability and permeability of OGD-induced BMECs by negatively modulating NOX4 expression. The transcription factor Foxo1 bound to the miR-92b promoter and restrained its expression. Foxo1 expression was induced by OGD-induction and its knockdown abolished the effects of OGD on miR-92b and NOX4 expressions, cell viability and permeability of BMECs. In general, our findings expounded that Foxo1-induced lessening miR-92b boosted BBB damage after ischaemic stroke by raising NOX4 expression.

Keywords: Foxo1; NOX4; blood-brain barrier; ischaemic stroke; miR-92b.


Conflict of interest statement

All authors declare that they have no conflicts of interest in this work.

Figures

FIGURE 1
FIGURE 1
The expression of miR‐92b in the ischaemic brain tissues and OGD‐induced BMECs. A, The expression of miR‐92b in the brain tissues of sham and MCAo rats was tested by qRT‐PCR. 8 rats per group. **P < 0.01 vs sham. SD (Sham): 0.29; SD (MCAo): 0.17. B, The expressions of miR‐92b in the rat primary BMECs, neurons, pericytes, astrocytes and microglia were tested by qRT‐PCR. SD (neurons): 3.85E‐06; SD (BMECs): 9.36E‐05; SD (pericytes): 8.50E‐05; SD (astrocytes): 4.57E‐05; SD (microglia): 3.97E‐06. C, BMECs, pericytes and astrocytes were induced by OGD for 6 h, respectively. The expression of miR‐92b in cells was tested by qRT‐PCR. *P < 0.05 vs Control; ns: no significant difference. SD (BMECs‐control): 0.20; SD (BMECs‐OGD): 0.05; SD (pericytes‐control): 0.26; SD (pericytes‐OGD): 0.13; SD (astrocytes‐control): 0.11; SD (astrocytes‐OGD): 0.21. D, Immortalized human BMECs (hCMEC/D3) were induced by OGD for 0, 4, 6, 8 or 10 h. The expression of miR‐92b in cells was tested by qRT‐PCR. *P < 0.05 or **P < 0.01 vs 0 h. SD (0 h): 0.14; SD (4 h): 0.13; SD (6 h): 0.06; SD (8 h): 0.09; SD (10 h): 0.06. Data are represented as the mean ± SD of three independent assays
FIGURE 2
FIGURE 2
The effect of miR‐92b overexpression on the BBB in the rat model of ischaemic stroke. The MCAo rats were injected with an adeno‐associated virus expressing miR‐92b or negative control (NC). A, The behavioural score was assessed by a 6‐point scale method. 10 rats per group. SD (MCAo): 1.14; SD (MCAo + NC): 0.71; SD (MCAo + miR‐92b): 0.89. B, The infarct area of the brains was assessed by TTC staining. Five rats per group and these sections were from equivalent areas of the brains. SD (MCAo): 5.13; SD (MCAo + NC): 4.61; SD (MCAo + miR‐92b): 3.66. C, The brain water content was tested. Six rats per group. SD (Sham): 1.76; SD (MCAo): 1.62; SD (MCAo + NC): 1.61; SD (MCAo + miR‐92b): 1.25. D, The BBB permeability was assessed by the Evans Blue staining. Six rats per group. SD (Sham): 0.14; SD (MCAo): 1.38; SD (MCAo + NC): 1.17; SD (MCAo + miR‐92b): 0.66. E, The expressions of junctional proteins (occludin, ZO‐1, VE‐cadherin in brains) were assessed by Western blot. Six rats per group. F, The activity of SOD in the brain was assessed by ELISA kits. SD (Sham): 0.94; SD (MCAo): 0.66; SD (MCAo + NC): 0.78; SD (MCAo + miR‐92b): 0.48. G, The ROS production in the brain was assessed by the DCFH‐DA method. SD (Sham): 11.66; SD (MCAo): 19.39; SD (MCAo + NC): 13.57; SD (MCAo + miR‐92b): 8.83. *P  < 0.05, **P < 0.01 vs sham or MCAo + NC. Data are represented as the mean ± SD of three independent assays
FIGURE 3
FIGURE 3
The effect of miR‐92b overexpression on the viability and permeability of OGD‐induced human BMECs. A‐C, hCMEC/D3 cells were transfected with miR‐92b mimic or negative control (mimic‐NC) and then induced by OGD for 6 h. A, The transfection efficiency of miR‐92b was assessed by qRT‐PCR. SD (Control): 0.20; SD (OGD): 0.09; SD (OGD + mimic‐NC): 0.06; SD (OGD + miR‐92b): 0.31. B, The viability of hCMEC/D3 cells was assessed by MTT assay. SD (Control): 0.13; SD (OGD): 0.04; SD (OGD + mimic‐NC): 0.08; SD (OGD + miR‐92b): 0.07. C, The permeability of hCMEC/D3 cells was assessed by the transendothelial electrical resistance (TEER). SD (Control): 8.02; SD (OGD): 3.51; SD (OGD + mimic‐NC): 5.69; SD (OGD + miR‐92b): 3.00. D‐E, hCMEC/D3 cells were transfected with miR‐92b mimic or negative control (NC) and then induced by OGD for 0, 1, 2, 3, 4, 5 and 6 h. The permeability of hCMEC/D3 cells was assessed by 4.4 kD TRITC‐dextran (D) and FITC‐dextran (E and F). D, SD (Control): 0.01; SD (OGD): 0.01; SD (OGD + mimic‐NC): 0.01; SD (OGD + miR‐92b): 0.01. E and F, SD (Control): 0.001; SD (OGD): 0.001; SD (OGD + mimic‐NC): 0.001; SD (OGD + miR‐92b): 0.001. *P < 0.05, **P < 0.01 vs control; #P < 0.05, ##P < 0.01 vs OGD + mimic‐NC. Data are represented as the mean ± SD of three independent assays
FIGURE 4
FIGURE 4
The effect on miR‐92b on the expression of NOX4. A, The binding sites of miR‐92b on the 3′‐UTR of NOX4. B, The wild‐type (WT) sequence of NOX4‐3′‐UTR (NOX4‐3′‐UTR‐WT) and mutated (MU) sequence of NOX4‐3′‐UTR (NOX4‐3′‐UTR‐MU) were subcloned into the upstream of the luciferase reporter gene in a pGL3 plasmid. Each recombinant vector was co‐transfected with miR‐92b mimic (or negative control: mimic‐NC) into 293T cells. Then, the luciferase activity was assessed by the Dual‐Luciferase Reporter Assay System. SD (NOX4‐3′‐UTR‐WT‐mimic‐NC): 0.21; SD (NOX4‐3′‐UTR‐WT‐miR‐92b mimic): 0.10; SD (NOX4‐3′‐UTR‐MU‐mimic‐NC): 0.20; SD (NOX4‐3′‐UTR‐MU‐miR‐92b mimic): 0.17. C and D, hCMEC/D3 cells were transfected with miR‐92b mimic, miR‐92b inhibitor or their negative controls (mimic‐NC and inhibitor NC), respectively. The mRNA level (C) and protein level (D) of NOX4 were tested by qRT‐PCR and Western blot, respectively. C, SD (mimic‐NC): 0.10; SD (miR‐92b mimic): 0.15; SD (inhibitor‐NC): 0.09; SD (miR‐92b inhibitor): 0.20. *P < 0.05, **P < 0.01 vs mimic‐NC or inhibitor‐NC. Data are represented as the mean ± SD of three independent assays
FIGURE 5
FIGURE 5
NOX4 mediated the effect of miR‐92b overexpression on the viability and permeability of OGD‐induced human BMECs. A‐E, hCMEC/D3 cells were co‐transfected with mimic‐NC and pcDNA, miR‐92b mimic and pcDNA, or miR‐92b mimic and pcDNA‐NOX4 and then induced by OGD for 4 h. A, The protein level of NOX4 was tested by Western blot. B, The viability of hCMEC/D3 cells was assessed by MTT assay. SD (OGD): 0.21; SD (OGD + mimic‐NC + pcDNA‐NC): 0.19; SD (OGD + miR‐92b mimic + pcDNA‐NC): 0.10; SD (OGD + miR‐92b mimic + pcDNA‐NOX4): 0.04. C, The transendothelial electrical resistance of hCMEC/D3 cells. SD (OGD): 4.51; SD (OGD + mimic‐NC + pcDNA‐NC): 2.52; SD (OGD + miR‐92b mimic + pcDNA‐NC): 3.51; SD (OGD + miR‐92b mimic + pcDNA‐NOX4): 1.53. D and E, The permeability of hCMEC/D3 cells was assessed by 4.4 kD TRITC‐dextran (D) and FITC‐dextran (E). D, SD (OGD): 0.004; SD (OGD + mimic‐NC + pcDNA‐NC): 0.003; SD (OGD + miR‐92b mimic + pcDNA‐NC): 0.03; SD (OGD + miR‐92b mimic + pcDNA‐NOX4): 0.01. E, SD (OGD): 0.001; SD (OGD + mimic‐NC + pcDNA‐NC): 0.001; SD (OGD + miR‐92b mimic + pcDNA‐NC): 0.01; SD (OGD + miR‐92b mimic + pcDNA‐NOX4): 0.003. F‐J, hCMEC/D3 cells were co‐transfected with inhibitor‐NC and si‐NC, miR‐92b inhibitor and si‐NC or miR‐92b inhibitor and si‐NOX4 and then induced by OGD for 4 h. F, The protein level of NOX4 was tested by Western blot. G, The viability of hCMEC/D3 cells was assessed by MTT assay. SD (OGD): 0.15; SD (OGD + inhibitor‐NC + pcDNA‐NC): 0.11; SD (OGD + miR‐92b inhibitor + si‐NC): 0.18; SD (OGD + miR‐92b inhibitor + si‐NOX4): 0.19. H, The transendothelial electrical resistance of hCMEC/D3 cells. SD (OGD): 4.36; SD (OGD + inhibitor‐NC + pcDNA‐NC): 2.52; SD (OGD + miR‐92b inhibitor + si‐NC): 4.51; SD (OGD + miR‐92b inhibitor + si‐NOX4): 4.00. I and J, The permeability of hCMEC/D3 cells was assessed by 4.4 kD TRITC‐dextran (I) and FITC‐dextran (J). I, SD (OGD): 0.02; SD (OGD + inhibitor‐NC + pcDNA‐NC): 0.04; SD (OGD + miR‐92b inhibitor + si‐NC): 0.02; SD (OGD + miR‐92b inhibitor + si‐NOX4): 0.01. J, SD (OGD): 0.003; SD (OGD + inhibitor‐NC + pcDNA‐NC): 0.003; SD (OGD + miR‐92b inhibitor + si‐NC): 0.002; SD (OGD + miR‐92b inhibitor + si‐NOX4): 0.002. *P < 0.05, **P < 0.01 vs OGD + mimic + pcDNA or inhibitor‐NC + si‐NC; #P < 0.05, ##P < 0.01 vs OGD + miR‐92b mimic + pcDNA or miR‐92b inhibitor + si‐NC. Data are represented as the mean ± SD of three independent assays
FIGURE 6
FIGURE 6
The effect of Foxo1 on miR‐92b expression in human BMECs. hCMEC/D3 cells were transfected with 1 µg or 3 µg pcDNA‐Foxo1. A, The transfection efficiency of pcDNA‐Foxo1 was assessed by qRT‐PCR and Western blot. SD (pcDNA‐NC): 0.18; SD (pcDNA‐Foxo1‐1 µg): 0.22; SD (pcDNA‐Foxo1‐3 µg): 0.34. B, The expression of miR‐92b was assessed by qRT‐PCR. SD (pcDNA‐NC): 0.11; SD (pcDNA‐Foxo1‐1 µg): 0.11; SD (pcDNA‐Foxo1‐3 µg): 0.14. C, The WT promoter sequence of miR‐92b (miR‐92b‐WT) and MU promoter sequence of miR‐92b (miR‐92b‐MU) were subcloned into the upstream of a luciferase reporter gene in a pGL3 plasmid. Each recombinant vector was co‐transfected with pcDNA‐Foxo1 (or negative control: pcDNA) into 293T cells. Then, the luciferase activity was assessed by the Dual‐Luciferase Reporter Assay System. SD (Luc‐miR‐92b‐WT‐pcDNA‐NC): 0.22; SD (Luc‐miR‐92b‐WT‐pcDNA‐Foxo1): 0.06. D, The enrichment of Foxo1 in the promoter of miR‐92b was assessed by CHIP assay. *P < 0.05, **P < 0.01 vs pcDNA‐NC. Data are represented as the mean ± SD of three independent assays
FIGURE 7
FIGURE 7
The effect of Foxo1 knockdown on the expressions of miR‐92b and NOX4, viability and permeability of OGD‐induced human BMECs. hCMEC/D3 cells were transfected with si‐Foxo1 or negative control (si‐NC) and then induced by OGD. A, The transfection efficiency of si‐Foxo1 was assessed by qRT‐PCR and Western blot. SD (Control): 0.22; SD (OGD): 0.08; SD (OGD + si‐NC): 0.03; SD (OGD + si‐Foxo1): 0.25. B, The expression of miR‐92b was assessed by qRT‐PCR. SD (Control): 0.20; SD (OGD): 0.08; SD (OGD + si‐NC): 0.04; SD (OGD + si‐Foxo1): 0.10. C, The expression of NOX4 was assessed by qRT‐PCR and Western blot. SD (Control): 0.18; SD (OGD): 0.21; SD (OGD + si‐NC): 0.06; SD (OGD + si‐Foxo1): 0.13. D, Cell viability was assessed by MTT assay. SD (Control): 0.09; SD (OGD): 0.08; SD (OGD + si‐NC): 0.08; SD (OGD + si‐Foxo1): 0.06. E, The TERR fo cells. SD (Control): 9.54; SD (OGD): 6.00; SD (OGD + si‐NC): 4.00; SD (OGD + si‐Foxo1): 4.16. F and G, The permeability of hCMEC/D3 cells was assessed by 4.4 kD TRITC‐dextran (F) and FITC‐dextran (G). F, SD (Control): 0.01; SD (OGD): 0.04; SD (OGD + si‐NC): 0.06; SD (OGD + si‐Foxo1): 0.02. G, SD (Control): 0.002; SD (OGD): 0.01; SD (OGD + si‐NC): 0.01; SD (OGD + si‐Foxo1): 0.004. *P < 0.05, **P < 0.01 vs control; #P < 0.05, ##P < 0.01 vs OGD + si‐NC. Data are represented as the mean ± SD of three independent assays

Similar articles

Cited by

References

    1. Jin K, Sun Y, Xie L, et al. Comparison of ischemia‐directed migration of neural precursor cells after intrastriatal, intraventricular, or intravenous transplantation in the rat. Neurobiol Dis. 2005;18(2):366‐374. 10.1016/j.nbd.2004.10.010 - DOI - PubMed
    1. Go AS, Mozaffarian D, Roger VL, et al. Heart disease and stroke statistics–2014 update: a report from the American Heart Association. Circulation. 2014;129(3):e28‐e292. 10.1161/01.cir.0000441139.02102.80 - DOI - PMC - PubMed
    1. Mozaffarian D, Benjamin EJ, Go AS, et al. Heart disease and stroke statistics‐2016 update: A report from the American Heart Association. Circulation. 2016;133(4):e38‐360. 10.1161/cir.0000000000000350 - DOI - PubMed
    1. Zhao YJ, Nai Y, Li SY, Zheng YH. Retigabine protects the blood‐brain barrier by regulating tight junctions between cerebral vascular endothelial cells in cerebral ischemia‐reperfusion rats. Eur Rev Med Pharmacol Sci. 2018;22(23):8509‐8518. 10.26355/eurrev_201812_16552 - DOI - PubMed
    1. Abdullahi W, Tripathi D, Ronaldson PT. Blood‐brain barrier dysfunction in ischemic stroke: targeting tight junctions and transporters for vascular protection. Am J Physiol Cell Physiol. 2018;315(3):C343‐c356. 10.1152/ajpcell.00095.2018 - DOI - PMC - PubMed

Publication types