

Integrated Analysis Reveals Prognostic Value and Immune Correlates of CD86 Expression in Lower Grade Glioma
- PMID: 33954112
- PMCID: PMC8089378
- DOI: 10.3389/fonc.2021.654350
Integrated Analysis Reveals Prognostic Value and Immune Correlates of CD86 Expression in Lower Grade Glioma
Abstract
Background: CD86 has great potential to be a new target of immunotherapy by regulating cancer immune response. However, it remains unclear whether CD86 is a friend or foe in lower-grade glioma (LGG).
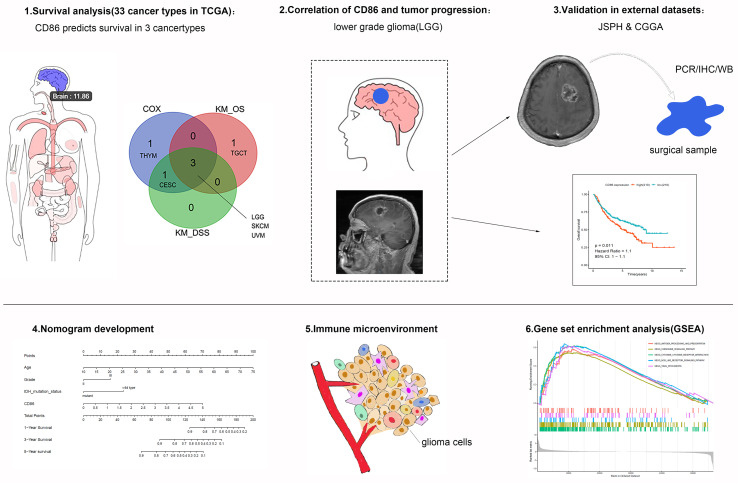
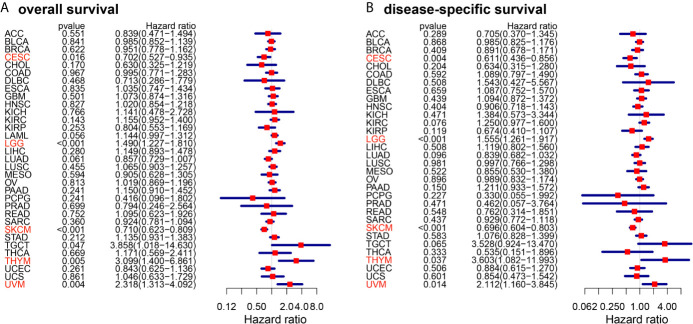
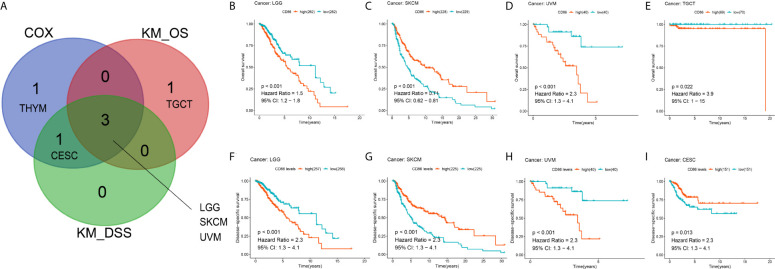
Methods: The prognostic value of CD86 expression in pan-cancer was analyzed using Cox regression and Kaplan-Meier analysis with data from the cancer genome atlas (TCGA). Cancer types where CD86 showed prognostic value in overall survival and disease-specific survival were identified for further analyses. The Chinese Glioma Genome Atlas (CGGA) dataset were utilized for external validation. Quantitative real-time PCR (qRT-PCR), Western blot (WB), and Immunohistochemistry (IHC) were conducted for further validation using surgical samples from Jiangsu Province hospital. The correlations between CD86 expression and tumor immunity were analyzed using the Estimation of Stromal and Immune cells in Malignant Tumours using Expression data (ESTIMATE) algorithm, Tumor IMmune Estimation Resource (TIMER) database, and expressions of immune checkpoint molecules. Gene Set Enrichment Analysis (GSEA) was performed using clusterprofiler r package to reveal potential pathways.
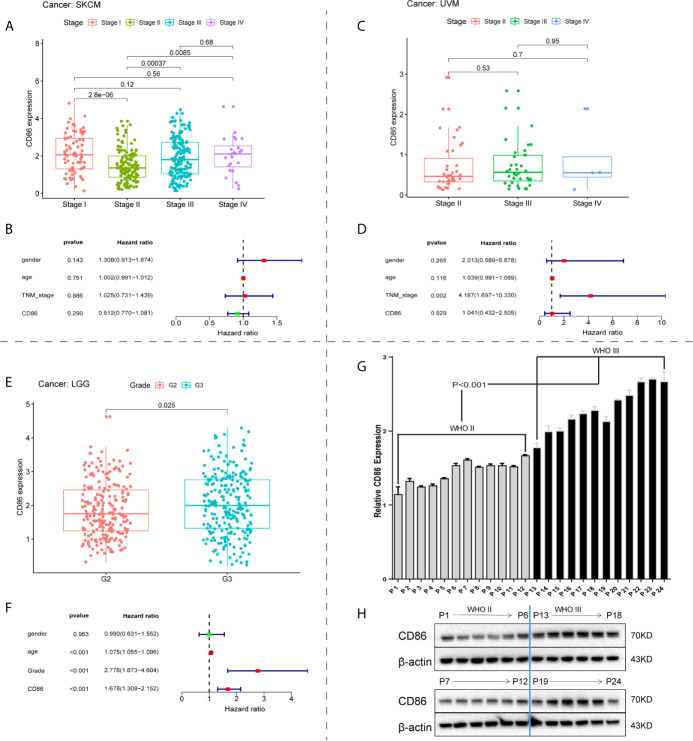
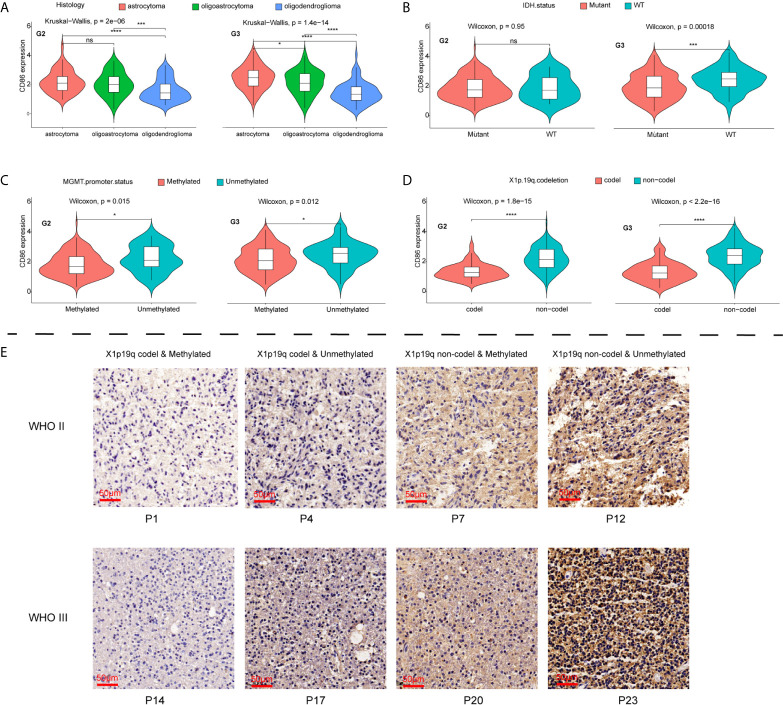
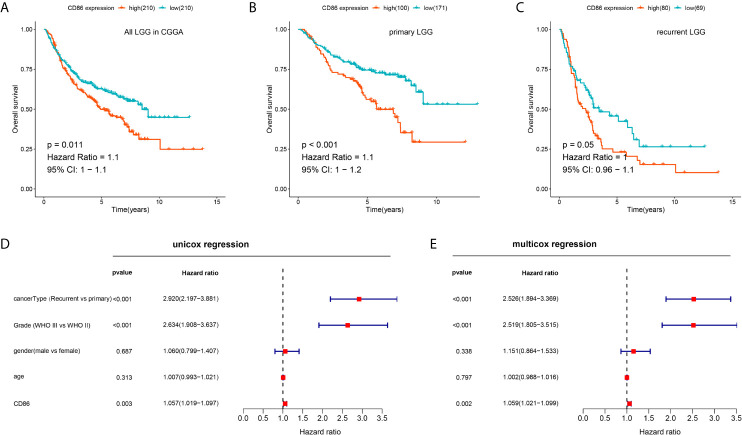
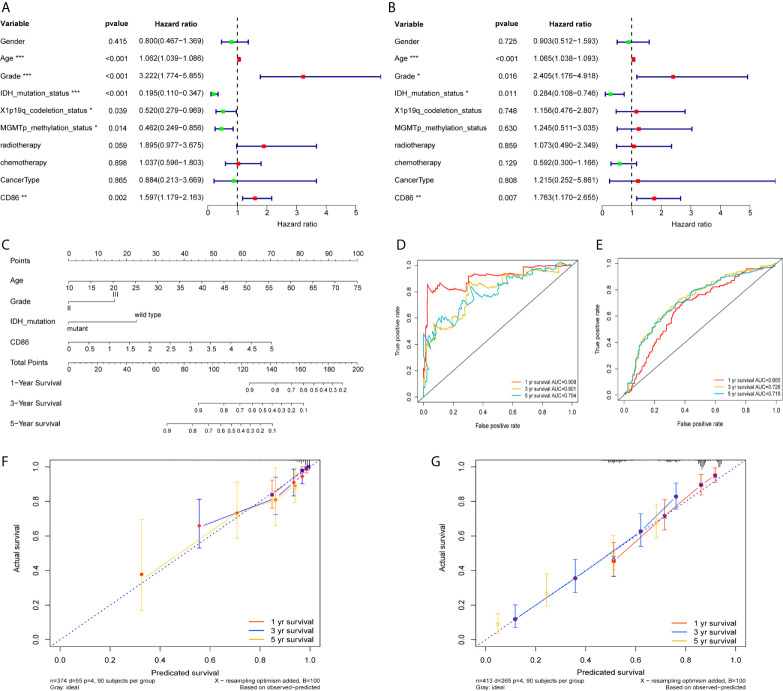
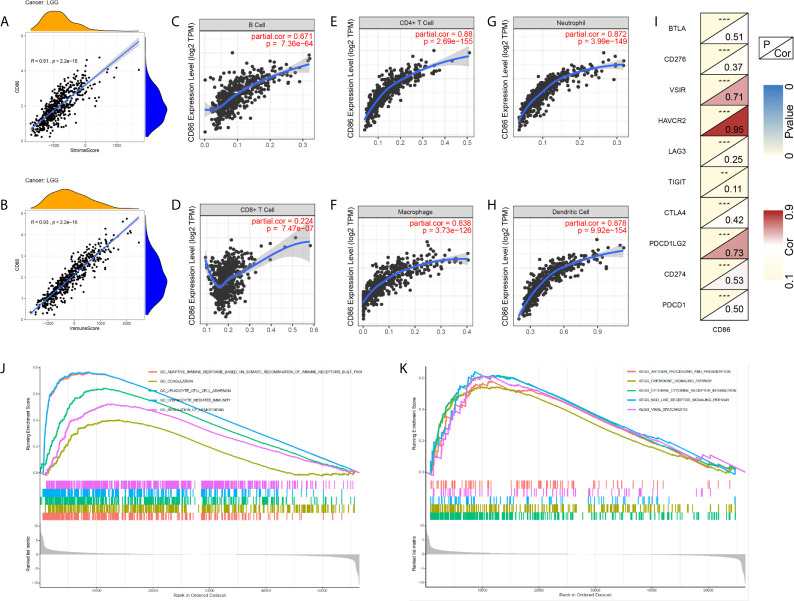
Results: Pan-cancer survival analysis established CD86 expression as an unfavorable prognostic factor in tumor progression and survival for LGG. CD86 expression between Grade-II and Grade-III LGG was validated using qRT-PCR and WB. Additionally, CD86 expression in LGG with unmethylated O(6)-methylguanine-DNA-methyltransferase (MGMT) promoter was significantly higher than those with methylated MGMT (P<0.05), while in LGG with codeletion of 1p/19q it was significantly downregulated as opposed to those with non-codeletion (P<2.2*10-16). IHC staining validated that CD86 expression was correlated with MGMT status and X1p/19q subtypes, which was independent of tumor grade. Multivariate regression validated that CD86 expression acts as an unfavorable prognostic factor independent of clinicopathological factors in overall survival of LGG patients. Analysis of tumor immunity and GSEA revealed pivotal role of CD86 in immune response for LGG.
Conclusions: Integrated analysis shows that CD86 is an unfavorable prognostic biomarker in LGG patients. Targeting CD86 may become a novel approach for immunotherapy of LGG.
Keywords: CD86; immune microenvironment; lower-grade glioma; pan-cancer analysis; prognosis.
Copyright © 2021 Qiu, Tian, He, Li, He, Li, Liu and Li.
Conflict of interest statement
The authors declare that the research was conducted in the absence of any commercial or financial relationships that could be construed as a potential conflict of interest.
Figures
Similar articles
-
Identification of Iron Metabolism-Related Genes as Prognostic Indicators for Lower-Grade Glioma.Front Oncol. 2021 Sep 9;11:729103. doi: 10.3389/fonc.2021.729103. eCollection 2021. Front Oncol. 2021. PMID: 34568059 Free PMC article.
-
EFNA1 is a potential key gene that correlates with immune infiltration in low-grade glioma.Medicine (Baltimore). 2021 Jun 4;100(22):e26188. doi: 10.1097/MD.0000000000026188. Medicine (Baltimore). 2021. PMID: 34087884 Free PMC article.
-
CKS2 (CDC28 protein kinase regulatory subunit 2) is a prognostic biomarker in lower grade glioma: a study based on bioinformatic analysis and immunohistochemistry.Bioengineered. 2021 Dec;12(1):5996-6009. doi: 10.1080/21655979.2021.1972197. Bioengineered. 2021. PMID: 34494924 Free PMC article.
-
LAMP1/2 as potential diagnostic and prognostic marker for brain lower grade glioma: A review.Medicine (Baltimore). 2023 Aug 18;102(33):e34604. doi: 10.1097/MD.0000000000034604. Medicine (Baltimore). 2023. PMID: 37603525 Free PMC article. Review.
-
Molecular subtypes based on PANoptosis-related genes and tumor microenvironment infiltration characteristics in lower-grade glioma.Funct Integr Genomics. 2023 Mar 17;23(2):84. doi: 10.1007/s10142-023-01003-5. Funct Integr Genomics. 2023. Retraction in: Funct Integr Genomics. 2024 May 11;24(3):88. doi: 10.1007/s10142-024-01374-3 PMID: 36930242 Retracted. Review.
Cited by
-
Patient-Derived Human Basal and Cutaneous Squamous Cell Carcinoma Tissues Display Apoptosis and Immunomodulation following Gas Plasma Exposure with a Certified Argon Jet.Int J Mol Sci. 2021 Oct 23;22(21):11446. doi: 10.3390/ijms222111446. Int J Mol Sci. 2021. PMID: 34768877 Free PMC article.
-
Medical gas plasma technology: Roadmap on cancer treatment and immunotherapy.Redox Biol. 2023 Sep;65:102798. doi: 10.1016/j.redox.2023.102798. Epub 2023 Jun 27. Redox Biol. 2023. PMID: 37556976 Free PMC article. Review.
-
Based on scRNA-seq and bulk RNA-seq to establish tumor immune microenvironment-associated signature of skin melanoma and predict immunotherapy response.Arch Dermatol Res. 2024 May 25;316(6):262. doi: 10.1007/s00403-024-03080-3. Arch Dermatol Res. 2024. PMID: 38795156
-
Integrative pan-cancer landscape of MMS22L and its potential role in hepatocellular carcinoma.Front Genet. 2022 Oct 6;13:1025970. doi: 10.3389/fgene.2022.1025970. eCollection 2022. Front Genet. 2022. PMID: 36276962 Free PMC article.
-
Ferroptosis-Related Gene Contributes to Immunity, Stemness and Predicts Prognosis in Glioblastoma Multiforme.Front Neurol. 2022 Mar 10;13:829926. doi: 10.3389/fneur.2022.829926. eCollection 2022. Front Neurol. 2022. PMID: 35359663 Free PMC article.
References
LinkOut - more resources
Full Text Sources
Other Literature Sources
Research Materials