. 2021 Jul 12;95(15):e0053021.
doi: 10.1128/JVI.00530-21. Epub 2021 Jul 12.

CCR2 Regulates Vaccine-Induced Mucosal T-Cell Memory to Influenza A Virus

Affiliations

CCR2 Regulates Vaccine-Induced Mucosal T-Cell Memory to Influenza A Virus

Woojong Lee et al. J Virol. .

Abstract

Elicitation of lung tissue-resident memory CD8 T cells (TRMs) is a goal of T cell-based vaccines against respiratory viral pathogens, such as influenza A virus (IAV). C-C chemokine receptor type 2 (CCR2)-dependent monocyte trafficking plays an essential role in the establishment of CD8 TRMs in lungs of IAV-infected mice. Here, we used a combination adjuvant-based subunit vaccine strategy that evokes multifaceted (TC1/TC17/TH1/TH17) IAV nucleoprotein-specific lung TRMs to determine whether CCR2 and monocyte infiltration are essential for vaccine-induced TRM development and protective immunity to IAV in lungs. Following intranasal vaccination, neutrophils, monocytes, conventional dendritic cells (DCs), and monocyte-derived dendritic cells internalized and processed vaccine antigen in lungs. We found that basic leucine zipper ATF-like transcription factor 3 (BATF3)-dependent DCs were essential for eliciting T cell responses, but CCR2 deficiency enhanced the differentiation of CD127hi, KLRG-1lo, OX40+ve CD62L+ve, and mucosally imprinted CD69+ve CD103+ve effector and memory CD8 T cells in lungs and airways of vaccinated mice. Mechanistically, increased development of lung TRMs induced by CCR2 deficiency was linked to dampened expression of T-bet but not altered TCF-1 levels or T cell receptor signaling in CD8 T cells. T1/T17 functional programming, parenchymal localization of CD8/CD4 effector and memory T cells, recall T cell responses, and protective immunity to a lethal IAV infection were unaffected in CCR2-deficient mice. Taken together, we identified a negative regulatory role for CCR2 and monocyte trafficking in mucosal imprinting and differentiation of vaccine-induced TRMs. Mechanistic insights from this study may aid the development of T-cell-based vaccines against respiratory viral pathogens, including IAV and severe acute respiratory syndrome coronavirus 2 (SARS-CoV-2). IMPORTANCE While antibody-based immunity to influenza A virus (IAV) is type and subtype specific, lung- and airway-resident memory T cells that recognize conserved epitopes in the internal viral proteins are known to provide heterosubtypic immunity. Hence, broadly protective IAV vaccines need to elicit robust T cell memory in the respiratory tract. We have developed a combination adjuvant-based IAV nucleoprotein vaccine that elicits strong CD4 and CD8 T cell memory in lungs and protects against H1N1 and H5N1 strains of IAV. In this study, we examined the mechanisms that control vaccine-induced protective memory T cells in the respiratory tract. We found that trafficking of monocytes into lungs might limit the development of antiviral lung-resident memory T cells following intranasal vaccination. These findings suggest that strategies that limit monocyte infiltration can potentiate vaccine-induced frontline T-cell immunity to respiratory viruses, such as IAV and SARS-CoV-2.

Keywords: CD8 T cells; adjuvants; influenza vaccines; memory; mucosal adjuvants; subunit vaccines; tissue-resident memory.


Figures
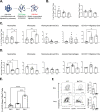
FIG 1
FIG 1
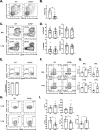
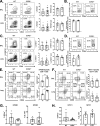
Dynamics of antigen processing by innate immune cells following intranasal vaccination. (A) Cartoon showing mechanism of action of DQ-OVA. Groups of C57BL/6 mice were vaccinated i.n. with DQ-OVA protein formulated in ADJ (5%) and GLA (5 μg). At days 2, 5, and 8 after immunization, single-cell suspensions of lung cells were stained with anti-CD11b, anti-Siglec-F, anti-CD11c, anti-CD64, anti-Ly6G, anti-Ly6C, anti-CD103, and anti-I-A/I-E. (B) Single-cell suspensions of lungs were analyzed for processed DQ-OVA (green and red fluorescence [DQ Green+/Red+]). (C) Percentages of innate immune cell subsets among all DQ Green+/Red+ cells. (D) Total numbers of innate immune subsets containing processed DQ-OVA in the lungs. (E) Percentages of DQ-Green+ and DQ-Red+ cells among CD103+ migratory DCs in LNs. (F) Wild-type (WT) and BATF3-deficient (BATF3−/−) mice were vaccinated intranasally with OVA (10 μg) formulated in ADJ (5%) plus GLA (5 μg). On day 8 after vaccination, the total number of activated OVA SIINFEKL-specific CD8 T cells in the lung and BAL fluid were quantified by staining with Kb/SIINFEKL tetramers, anti-CD8, and anti-CD44; FACS plots are gated on total live CD8 T cells, and the numbers are percentages of tetramer-binding cells among gated CD8 T cells. The data are pooled from two independent experiments (B to F). Tukey's multiple-comparison test (B to E); Mann-Whitney’s U test (F). *, **, and *** indicate significance at P values of <0.05, <0.01, and <0.001, respectively.
FIG 2
FIG 2
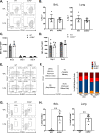
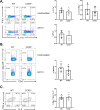
Effector CD8 T cell response to adjuvanted subunit vaccine in CCR2−/− mice. Wild-type (WT) or CCR2−/− mice were immunized intranasally (i.n.) twice (21 days apart) with influenza A H1N1 nucleoprotein (NP) formulated in ADJ (5%) and GLA (5 μg). To distinguish nonvascular cells from vascular cells in the lungs, mice were injected intravenously with fluorescence-labeled anti-CD45.2 antibodies, 3 min prior to euthanasia (CD45.2+ve, vascular; CD45.2−ve, nonvascular.) At day 8 postvaccination, single-cell suspensions prepared from the lungs and bronchoalveolar lavage (BAL) fluid were stained with viability dye, followed by Db/NP366 tetramers in combination with anti-CD4, anti-CD8, anti-CD44, anti-CD69, anti-CD103, anti-T-bet, and anti-TCF-1. (A and B) Lung cells were stained for innate immune cell markers as described in the legend to Fig. 1. Data are percentages of monocytes in the lungs of vaccinated WT and CCR2−/− mice. (C and D) FACS plots show percentages of NP366 tetramer-binding cells among CD8 T cells. (E) Percentages of vascular and nonvascular cells among NP366-specific CD8 T cells. (F to I) FACS plots are gated on Db/NP366 tetramer-binding CD8 T cells, and numbers are percentages of CD69+/CD103+ (F and G) and T-bet+ and TCF-1+ (H and I) cells in the respective gates or quadrants. (I) MFI of TCF-1 and T-bet in NP366-specific CD8 cells in lungs and ratio of TCF-1 to T-bet MFI in NP366-specific CD8 cells in lungs. Data are pooled from three independent experiments (C and D) or represent one of three independent experiments (A, B, and F to I). Mann-Whitney U test; *, **, and *** indicate significance at P values of <0.05, <0.01, and <0.001, respectively.
FIG 3
FIG 3
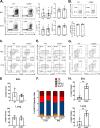
Role of CCR2 in regulating TCR signaling and terminal differentiation of vaccine-induced effector CD8 T cells. WT and CCR2−/− mice were immunized as described in the legend to Fig. 2. At day 8 postvaccination, single-cell suspensions prepared from the lungs and bronchoalveolar lavage (BAL) fluid were stained with viability dye, followed by Db/NP366 tetramers in combination with anti-CD4, anti-CD8, anti-CD44, anti-KLRG1, anti-CD127, anti-CD62L, and anti-OX40. FACS plots are gated on Db/NP366 tetramer-binding CD8 T cells, and numbers are percentages of PD-1+ (A and B), CD127+/−/KLRG1+/− (E and F), and CD62L+/OX40+ (G and H) cells in the respective gates or quadrants. (C and D) Naïve CD45.1+ Nur77-eGFP OT-I CD8 T cells were adoptively transferred into congenic CD45.2 C57BL/6 mice. Twenty-four hours after cell transfer, mice were vaccinated i.n. with OVA formulated in ADJ (5%) and GLA (5 μg). At day 2, 5, or 8 postvaccination, single-cell suspensions from mediastinal lymph nodes and lungs were stained with anti-CD8, anti-CD45.1, and Kb/SIINFEKL tetramers. The MFIs of Nur77-eGFP in donor CD45.1+ve OT-I CD8 T cells were quantified by flow cytometry. The data represent one of two (C, D, G, and H) or three (A, B, E, and F) independent experiments. Mann-Whitney U test; *, **, and *** indicate significance at P values of <0.05, <0.01, and <0.001, respectively.
FIG 4
FIG 4
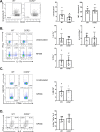
Effector CD4 T cell responses to adjuvanted subunit vaccine in CCR2−/−mice. Wild-type (WT) or CCR2−/− mice were vaccinated as described in the legend to Fig. 2. To distinguish nonvascular cells from vascular cells in the lungs, mice were injected intravenously with fluorescence-labeled anti-CD45.2 antibodies, 3 min prior to euthanasia (CD45.2+ve, vascular; CD45.2−ve, nonvascular). On day 8 after vaccination, single-cell suspensions prepared from the lungs and bronchoalveolar lavage (BAL) fluid were stained with viability dye, followed by I-Ab/NP311 tetramers in combination with anti-CD4, anti-CD8, anti-CD44, anti-CD69, anti-KLRG1, anti-CD127, anti-OX40, and anti-CD62L antibodies (A and C to H). (A) FACS plots show percentages of tetramer-binding cells among CD4 T cells. (B) Percentages of vascular and nonvascular cells among NP311-specific CD4 T cells. Data are pooled from two independent experiments (A) or represent one of three independent experiments (B to H). Mann-Whitney U test; *, **, and *** indicate significance at P values of <0.05, <0.01, and <0.001, respectively.
FIG 5
FIG 5
Functional polarization of effector CD8 T cells in vaccinated CCR2−/− mice. Wild-type (WT) or CCR2−/− mice were vaccinated as described in the legend to Fig. 2. On day 8 after vaccination, lung cells were cultured with NP366 peptide, recombinant IL-2, and brefeldin A for 5 h. The percentages of NP366-specific CD8 T cells that produced IL-17α, IFN-γ, IL-2, TNF-α, and GM-CSF were quantified by intracellular cytokine staining. (A) Percentages of IFN-γ/IL-17α-producing cells among the gated CD8 T cells. (B) Percentages of GM-CSF-producing cells among the gated CD8 T cells. (C) Percentages of IL-2/TNF-α-producing cells among the gated IFN-γ-producing CD8 T cells. Cells cultured without the NP366 peptide (unstimulated) served as a negative control. Data in each graph are mean ± standard error of the mean (SEM). Mann-Whitney U test; *, **, and *** indicate significance at P values of <0.05, <0.01, and <0.001 respectively. Each independent experiment had 3 to 5 mice per group. Data represent one of three independent experiments.
FIG 6
FIG 6
Functional polarization of effector CD4 T cells in vaccinated CCR2−/−mice. Wild-type (WT) or CCR2−/− mice were vaccinated as described in the legend to Fig. 2. On day 8 after vaccination, lung cells were cultured with NP311 peptide, recombinant IL-2, and brefeldin A for 5 h. The percentages of NP311-specific CD4 T cells that produced IL-17α, IFN-γ, IL-2, TNF-α, and GM-CSF were quantified by intracellular cytokine staining. (A) Percentages of IFN-γ/IL-17α-producing cells among the gated CD4 T cells. (B) Percentages of GM-CSF-producing cells among the gated CD4 T cells. (C) Percentages of IL-2/TNF-α-producing cells among the gated IFN-γ-producing CD4 T cells. Cells cultured without the NP311 peptide (unstimulated) served as a negative control. Data in each graph are the mean ± SEM. Mann-Whitney U test; *, **, and *** indicate significance at P values of <0.05, <0.01, and <0.001, respectively. Each independent experiment had 3 to 5 mice per group. Data represent one of three independent experiments.
FIG 7
FIG 7
Vaccine-induced CD8 and CD4 T cell memory in CCR2−/− mice. Wild-type (WT) and CCR2−/− mice were vaccinated as described in the legend to Fig. 2. At 60 days after booster vaccination, the percentages and total numbers of memory NP366-specific CD8 T cells (A) and NP311-specific CD4 T cells (C) were quantified in lungs and airways (BAL fluid). To distinguish nonvascular cells from vascular cells in the lungs, mice were injected intravenously with fluorescence-labeled anti-CD45.2 antibodies, 3 min prior to euthanasia (CD45.2+ve, vascular; CD45.2−ve, nonvascular). Single-cell suspensions from lungs or BAL fluid were stained with Db/NP366, I-Ab/NP311, anti-CD8, anti-CD44, anti-CD103, and anti-CD69. All FACS plots in this figure are gated on tetramer-binding CD8 or CD4 T cells. (A and C) Percentages and total numbers of NP366-specific CD8 (A) and NP311-specific CD4 (C) T cells in BAL fluid and lungs. (B and D) Percentages of vascular and nonvascular cells among NP366-specific CD8 (B) and NP311-specific CD4 (D) T cells. (E and F) CD69+ and/or CD103+ cells among NP366-specific CD8 (E) or NP311-specific CD4 (F) T cells in lungs. (G and H) Single-cell suspensions from lungs were cultured with or without NP366 (G) or NP311 (H) peptides in the presence of recombinant IL-2 and brefeldin A for 5 h. The percentages of NP366-specific CD8 T cells or NP311-specific CD4 T cells that produced IL-17α and/or IFN-γ were quantified by intracellular cytokine staining. Data in each graph are the mean ± SEM. Mann-Whitney U test; *, **, and *** indicate significance at P values of <0.05, <0.01, and <0.001, respectively. Each independent experiment had 3 to 6 mice per group. Data are pooled from two independent experiments (A and C) or represent one of two independent experiments (B, D, and E to H).
FIG 8
FIG 8
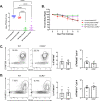
Vaccine-induced protective immunity to influenza A virus in wild-type (WT) and CCR2−/− mice. At 50 to 60 days after booster vaccination, WT or CCR2−/− mice were intranasally challenged with 500 PFU of the pathogenic PR8/H1N1 strain of influenza A virus. (A) Viral titers were quantified in the lungs on day 6 after challenge. (B) Following viral challenge, body weights were measured and plotted as a percentage of starting body weight prior to challenge. Single-cell suspensions prepared from lungs and bronchoalveolar lavage (BAL) fluid were stained with viability dye, followed by Db/NP366 and I-Ab/NP311 tetramers in combination with anti-CD4, anti-CD8, and anti-CD44. (C and D) Frequencies and total numbers of NP366-specific CD8 (C) and NP311-specific CD4 (D) T cells in lungs. FACS plots are gated on total CD8 (C) or CD4 (D) T cells. Each independent experiment had 3 to 6 mice per group. Data in each graph are the mean ± SEM. The data are pooled from two independent experiments (A and B) or represent one of two independent experiments (C and D). Mann-Whitney U test; *, **, and *** indicate significance at P values of <0.05, <0.01, and <0.001, respectively.
FIG 9
FIG 9
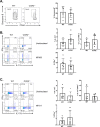
Effector functions of recall CD8 and CD4 T cells in influenza virus-challenged wild-type (WT) and CCR2−/− mice. At 50 days after booster vaccination, WT or CCR2−/− mice were challenged with H1N1/PR8 strain of influenza A virus. On day 6 after viral challenge, functions of antigen-specific CD4 and CD8 T cells in lungs were analyzed. (A) Single-cell suspensions of lungs were stained directly ex vivo with Db/NP366 tetramers along with anti-CD8, anti-CD44, and anti-granzyme B antibodies. FACS plots are gated on tetramer-binding CD8 T cells, and numbers are percentages of granzyme B+ve cells among the gated population. (B and C) Single-cell suspensions of lungs were cultured with NP366 or NP311 peptides, and IFN-γ- and/or IL-17α-producing CD8 or CD4 T cells were quantified by intracellular cytokine staining. Plots are gated on total CD8 and CD4 T cells, respectively. Numbers are percentages of IFN-γ- and/or IL-17-α-producing cells among the gated population. Data are representative of two independent experiments. Mann-Whitney U test; *, **, and *** indicate significance at P values of <0.05, <0.01, and <0.001, respectively.
FIG 10
FIG 10
Polyfunctionality of recall CD8 and CD4 T cells in influenza virus-challenged wild-type (WT) and CCR2−/−mice. At 50 to 60 days after booster vaccination, B6 or CCR2−/− mice were challenged with the pathogenic PR8/H1N1 strain of influenza A virus. Single-cell suspensions of lungs from challenged mice were ex vivo stimulated with NP366 (A and C) or NP311 peptides (B and D). The percentages of NP366-stimulated CD8 T cells that coproduced IFN-γ, TNF-α, and IL-2 (A) or GM-CSF (C) were quantified by intracellular cytokine staining. Graphs show the percentages of cytokine-producing cells among the gated CD8 T cells. IL-2- and TNF-α-coproducing cells were gated on IFN-γ-producing CD8 T cells. The percentages of NP311-stimulated CD4 T cells that coproduced IFN-γ, TNF-α, and IL-2 (B) or GM-CSF (D) were quantified by intracellular cytokine staining. Graphs show the percentages of cytokine-producing cells among the gated CD4 T cells. IL-2- and TNF-α-coproducing cells were among the gated IFN-γ-producing CD4 T cells. Data are representative of two independent experiments. Mann-Whitney U test; *, **, and *** indicate significance at P values of <0.05, <0.01, and <0.001, respectively.

Update of

Similar articles

Cited by

References

    1. Banchereau J, Steinman RM. 1998. Dendritic cells and the control of immunity. Nature 392:245–252. 10.1038/32588. - DOI - PubMed
    1. Henri S, Vremec D, Kamath A, Waithman J, Williams S, Benoist C, Burnham K, Saeland S, Handman E, Shortman K. 2001. The dendritic cell populations of mouse lymph nodes. J Immunol 167:741–748. 10.4049/jimmunol.167.2.741. - DOI - PubMed
    1. Villadangos JA, Heath WR. 2005. Life cycle, migration and antigen presenting functions of spleen and lymph node dendritic cells: limitations of the Langerhans cells paradigm. Semin Immunol 17:262–272. 10.1016/j.smim.2005.05.015. - DOI - PubMed
    1. Kim TS, Braciale TJ. 2009. Respiratory dendritic cell subsets differ in their capacity to support the induction of virus-specific cytotoxic CD8+ T cell responses. PLoS One 4:e4204. 10.1371/journal.pone.0004204. - DOI - PMC - PubMed
    1. Kohlmeier JE, Cookenham T, Miller SC, Roberts AD, Christensen JP, Thomsen AR, Woodland DL. 2009. CXCR3 directs antigen-specific effector CD4+ T cell migration to the lung during parainfluenza virus infection. J Immunol 183:4378–4384. 10.4049/jimmunol.0902022. - DOI - PMC - PubMed

Publication types

MeSH terms