. 2021 May 5;7(19):eabf3114.
doi: 10.1126/sciadv.abf3114. Print 2021 May.

A parental transcriptional response to microsporidia infection induces inherited immunity in offspring

Affiliations

A parental transcriptional response to microsporidia infection induces inherited immunity in offspring

Alexandra R Willis et al. Sci Adv. .

Abstract

Parental infection can result in the production of offspring with enhanced immunity phenotypes. Critically, the mechanisms underlying inherited immunity are poorly understood. Here, we show that Caenorhabditis elegans infected with the intracellular microsporidian parasite N. parisii produce progeny that are resistant to microsporidia infection. We determine the kinetics of the response and show that intergenerational immunity prevents host-cell invasion by Nematocida parisii and enhances survival to the bacterial pathogen Pseudomonas aeruginosa We demonstrate that immunity is induced by the parental transcriptional response to infection, which can be mimicked through maternal somatic depletion of PALS-22 and the retinoblastoma protein ortholog, LIN-35. We find that other biotic and abiotic stresses (viral infection and cadmium exposure) that induce a similar transcriptional response as microsporidia also induce immunity in progeny. Together, our results reveal how a parental transcriptional signal can be induced by distinct stimuli and protect offspring against multiple classes of pathogens.


Figures

Fig. 1
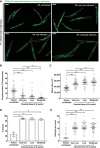
Fig. 1. Parental infection by N. parisii confers immunity to the progeny of C. elegans.
L1 stage N2 C. elegans were uninfected or exposed to varying concentrations of N. parisii spores (doses defined in Materials and Methods) for 72 hours. F1 L1 larvae were collected and infected with a high dose of N. parisii, fixed at 72 hpi, and stained with DY96. (A) Representative images of F1 populations stained with DY96, which binds to worm embryos and N. parisii spores. Scale bars, 200 μm. (B) Quantitation of DY96 fluorescent spores per worm. (C) Quantitation of worm area. (D) Percentage of worms that are gravid. (E) Number of embryos per worm. (B to E) Means ± SEM (horizontal bars) are shown. Data pooled from three independent experiments using n = 20 (B, C, and E) or n = 98 to 351 (D) worms per condition per experiment. The P values were determined by unpaired two-tailed Student’s t test. Significance with Bonferroni correction was defined as P < 0.0166. **P < 0.0033; ***P < 0.00033.
Fig. 2
Fig. 2. Inherited immunity prevents microsporidia invasion and P. aeruginosa colonization but not viral infection.
L1 stage N2 C. elegans were either not infected or infected with a low dose of N. parisii spores for 72 hpi. (A to D) F1 L1 larvae were exposed to a maximal dose of N. parisii, fixed at 30 mpi, and stained with DY96 (green), as well as a FISH probe to detect N. parisii 18S RNA (red). (A) Representative images of worms stained with FISH probe to detect invaded sporoplasms, marked by asterisks. Scale bars, 25 μm. (B) Number of sporoplasms per worm. Data pooled from three independent experiments using n = 16 to 20 worms per condition per experiment. (C) Representative images of worms stained with DY96 to detect spores, marked by asterisks, in the intestinal lumen. Scale bars, 25 μm. (D) Number of spores per worm. Data pooled from three independent experiments using n = 20 to 21 worms per condition per experiment. (E) F1 L1 larvae were fed fluorescent beads and fixed after 30 min. Quantitation of bead fluorescence per worm. Data pooled from three independent experiments using n = 24 to 30 worms per condition per experiment. (F) F1 L1 larvae were maintained on slow-killing plates with wild-type P. aeruginosa, and survival at 84 hpi was assessed. Data pooled from four independent experiments, each comprising two to four technical replicates, using n = 13 to 37 worms per condition per experiment. (G and H) F1 L1 larvae were maintained on slow-killing plates with dsRed–P. aeruginosa and fixed at 48 hpi. (G) Representative images of worm populations. Scale bars, 200 μm. (H) Quantitation of dsRed fluorescence per worm. Data pooled from three independent experiments using n = 21 to 47 worms per condition per experiment. (I) Naïve and primed F1 and pals-22 mutant L1 larvae were infected with Orsay virus, fixed at 16 hpi, and stained with FISH probe to detect Orsay virus RNA. Data pooled from four independent experiments with n = 52 to 158 worms per condition per experiment. Means ± SEM (horizontal bars) are shown. The P values were determined by unpaired two-tailed Student’s t test. (B, D to F, and H) Significance was defined as P < 0.05. ***P < 0.001. (I) Significance with Bonferroni correction was defined as follows: ***P < 0.0005.
Fig. 3
Fig. 3. Inherited immunity in N. parisii primed C. elegans lasts a single generation and is strongest in early larval stages.
(A to C) L1 stage N2 C. elegans were either not infected or infected with a low dose of N. parisii spores for 72 hpi. (A and B) F1 embryo populations were then split and either tested for immunity or maintained under noninfection conditions for the collection and subsequent testing of F2 embryos. F1 and F2 L1 larvae were exposed to a high dose of N. parisii, fixed at 72 hpi, and stained with DY96. (A) Percentage of animals infected. (B) Percentage of worms that are gravid. (C) F1 larvae were challenged with a maximal dose of N. parisii spores at either the L1, L2/L3, or L4 stage; fixed at 30 mpi; and stained with N. parisii 18S RNA FISH probe. Number of sporoplasms per worm. Data pooled from three independent experiments using n = 16 to 20 (A and B) or n = 12 to 20 (C) worms per condition per experiment. (D and E) L1 stage N2 C. elegans (P0, F1, and F2) were infected with N. parisii for 72 hours, for either one, two, or three successive generations (see schematic in fig. S6C). F3 L1 larvae were exposed to a high dose of N. parisii, fixed at 72 hpi, and stained with DY96. (D) Quantitation of DY96 fluorescent spores per worm. (E) Number of embryos per worm. Data pooled from two independent experiments using n = 25 (D) or n = 30 (E) worms per condition per experiment. (F and G) N2 C. elegans were either not infected or infected with a low dose of N. parisii spores at the L1 stage (for 72 hours), L2/L3 stage (for 48 hours), or L4 stage (for 24 hours). F1 worms were infected with N. parisii as in (A). (F) Percentage of worms infected. Data pooled from three independent experiments using n = 100 to 197 worms per condition per experiment. (G) Percentage of worms that are gravid. Data pooled from four independent experiments using n = 100 to 197 worms per condition per experiment. Means ± SEM (horizontal bars) are shown. The P values were determined by unpaired two-tailed Student’s t test. (A, B, and G) Significance was defined as follows: *P < 0.05; **P < 0.01. (C and F) Significance with Bonferroni correction was defined as follows: *P < 0.025; **P < 0.005; ***P < 0.0005. (D and E) Significance with Bonferroni correction was defined as follows: ***P < 0.00033.
Fig. 4
Fig. 4. The parental transcriptional response to N. parisii triggers inherited immunity.
(A and B) L1 stage N2 C. elegans were either not infected or exposed to a low dose of live or heat-killed N. parisii spores for 72 hpi. F1 L1 larvae were exposed to a high dose of N. parisii, fixed at 72 hpi, and stained with DY96. (A) Percentage of worms infected. (B) Percentage of worms that are gravid. (C and D) L1 N2 and rde-1 mutants were not infected, infected with a low dose of N. parisii, or infected with Orsay virus for 72 hpi. F1 worms were infected with N. parisii as in (A). (C) Percentage of worms infected. (D) Percentage of worms that are gravid. (E and F) N2 C. elegans were either untreated or infected with a low dose of N. parisii spores or exposed to 50 mM cadmium from the L4 stage for 24 hours. F1 worms were infected with N. parisii as in (A). (E) Percentage of worms infected. (F) Number of embryos per worm. (G and H) L1 stage N2 C. elegans were either untreated, infected with a low dose of N. parisii spores on standard nematode growth media (NGM; 50 mM salt), or maintained on NGM containing 250 mM salt for 72 hours. (G) Percentage of F1 embryos hatching on 420 mM salt. (H) F1 worms were infected with N. parisii as in (A). Number of embryos per worm. (A to D) Data pooled from three independent experiments using n = 100 worms per condition per experiment. (E and F) Data pooled from four independent experiments using n = 100 worms (E) or n = 25 to 30 worms (F) per condition per experiment. (G) Data pooled from seven independent experiments using n = 100 to 215 worms per condition per experiment. (H) Data pooled from three independent experiments using n = 25 worms per condition per experiment. (A to H) Means ± SEM (horizontal bars) are shown. The P values were determined by unpaired two-tailed Student’s t test. Significance with Bonferroni correction was defined as follows: *P < 0.025; **P < 0.005; ***P < 0.0005.
Fig. 5
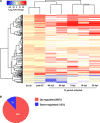
Fig. 5. N. parisii infection induces many genes that are also up-regulated in both lin-35 and pals-22 mutants.
A shared transcriptional response was identified by determining genes that were either up- or down-regulated in both lin-35 and pals-22 mutants and at least one N. parisii infection time point. (A) Heatmap showing cluster analysis of the shared transcriptional response with the fold change of each cell corresponding to scale at the top. White cells in the heatmap represent genes not determined to be differentially expressed. (B) Fraction of shared genes that are either up- or down-regulated.
Fig. 6
Fig. 6. Mutants that phenocopy the transcriptional response to infection transfer immunity to offspring through the maternal germ line.
(A and B) L1 stage N2, pals-22(jy1), and lin-35(n745) worms were not infected or infected with a high dose of N. parisii, fixed at 72 hpi, and stained with DY96. (A) Quantitation of DY96 fluorescent spores per worm. (B) Number of embryos per worm. (A and B) Data pooled from three independent experiments using n = 20 worms per condition per experiment. (C) Schematic of mating to obtain maternal and paternal cross-progeny. Myo-2p::mCherry was used as a marker to distinguish cross-progeny from self-progeny. (D to G) P0 animals were allowed to mate for 24 hours. F1 worms were infected with N. parisii as in (A). (D) Quantitation of DY96 fluorescent spores per worm. (E) Number of embryos per worm. (D and E) Data pooled from three independent experiments using n = 20 worms per condition per experiment. Only hermaphrodite maternal cross-progeny were included in quantifications. (F and G) Percentage of worms that are gravid. Data pooled from three independent experiments using n = 13 to 67 worms per condition per experiment. Means ± SEM (horizontal bars) are shown. The P values were determined by ordinary one-way ANOVA with post hoc test . Significance was defined as follows: *P < 0.05; ***P < 0.001; ****P < 0.0001.
Fig. 7
Fig. 7. Induction of the IPR in somatic tissues induces inherited immunity.
N2, pals-22, and lin-35 mutants with various rescue transgenes were allowed to mate for 24 hours. F1 L1 larvae were exposed to a high dose of N. parisii, fixed at 72 hpi, and stained with DY96. (A and C) Quantitation of DY96 fluorescent spores per worm. Data pooled from three independent experiments using n = 7 to 20 worms per condition per experiment. (B and D) Percentage of worms that are gravid. Data pooled from three independent experiments using n = 17 to 78 worms per condition per experiment. Tissues expressing the rescue transgenes are indicated on the graph. Only hermaphrodite maternal cross-progeny were included in quantifications. Means ± SEM (horizontal bars) are shown. The P values were determined by ordinary one-way ANOVA with post hoc test. Significance was defined as follows: *P < 0.05; **P < 0.01; ***P < 0.001; ****P < 0.0001.
Fig. 8
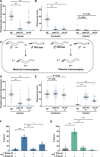
Fig. 8. Somatic depletion of negative regulators of the IPR for a single generation induces inherited immunity.
(A to D) P0 animals were grown on either control plates or plates containing 200 μM auxin from embryos to mediate degradation of PALS-22 or LIN-35 for 72 hours. F1 L1 larvae were exposed to a high dose of N. parisii, fixed at 72 hpi, and stained with DY96. (A and C) Quantitation of DY96 fluorescent spores per worm. Data pooled from three independent experiments using n = 19 to 39 worms per condition per experiment. (B and D) Percentage of worms that are gravid. Data pooled from three independent experiments using n = 100 to 214 worms per condition per experiment. Tissues where degradation was induced by auxin are indicated under the graphs. Means ± SEM (horizontal bars) are shown. The P values were determined by unpaired two-tailed Student’s t test. Significance was defined as follows: *P < 0.05; **P < 0.01; ***P < 0.001.

Similar articles

Cited by

References

    1. Tetreau G., Dhinaut J., Gourbal B., Moret Y., Trans-generational immune priming in invertebrates: Current knowledge and future prospects. Front. Immunol. 10, 1938 (2019). - PMC - PubMed
    1. Barribeau S. M., Schmid-Hempel P., Sadd B. M., Royal Decree: Gene expression in trans-generationally immune primed bumblebee workers mimics a primary immune response. PLOS ONE 11, e0159635 (2016). - PMC - PubMed
    1. Salmela H., Amdam G. V., Freitak D., Transfer of immunity from mother to offspring is mediated via egg-yolk protein vitellogenin. PLOS Pathog. 11, e1005015 (2015). - PMC - PubMed
    1. Little T. J., O’Connor B., Colegrave N., Watt K., Read A. F., Maternal transfer of strain-specific immunity in an invertebrate. Curr. Biol. 13, 489–492 (2003). - PubMed
    1. Norouzitallab P., Baruah K., Vandegehuchte M., Van Stappen G., Catania F., Bussche J. V., Vanhaecke L., Sorgeloos P., Bossier P., Environmental heat stress induces epigenetic transgenerational inheritance of robustness in parthenogenetic Artemia model. FASEB J. 28, 3552–3563 (2014). - PubMed

Publication types